Figure 1.

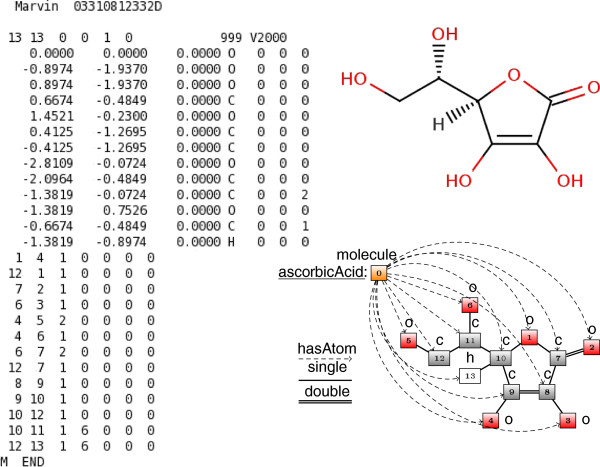
Ascorbic acid representations. Molfile (left), molecular graph (top right) and description graph (bottom right) encoding the molecular structure of ascorbic acid.

Ascorbic acid representations. Molfile (left), molecular graph (top right) and description graph (bottom right) encoding the molecular structure of ascorbic acid.