Figure 3.

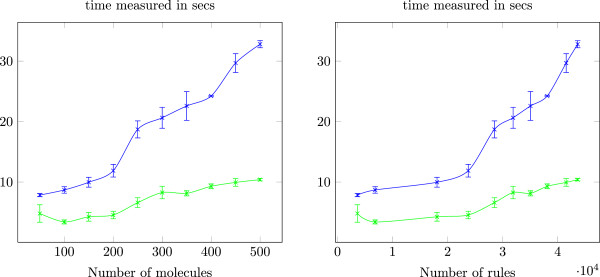
Classification times. Curves of classification times with respect to number of molecules (left) and number of rules (right). The lower line is for ‘with cyclic’ mode and the upper for ‘no cyclic’ mode.

Classification times. Curves of classification times with respect to number of molecules (left) and number of rules (right). The lower line is for ‘with cyclic’ mode and the upper for ‘no cyclic’ mode.