
Figure 2.
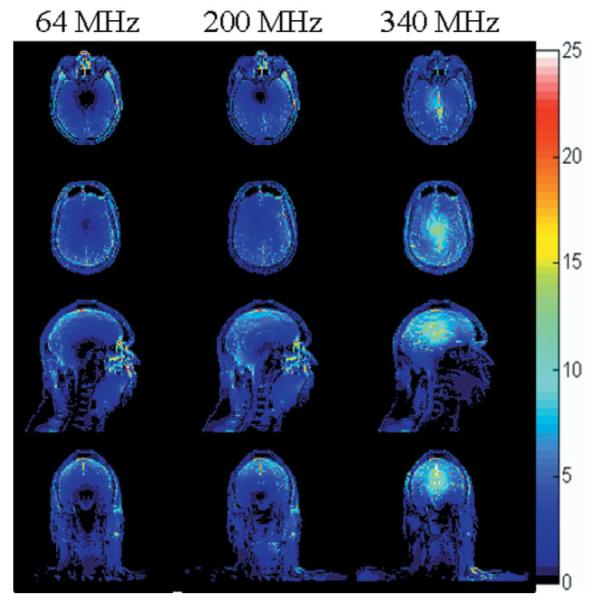
SAR distribution (W/kg) at model resolution (3 mm) at three of the frequencies modeled during exposure to a head-average SAR of 3.0 W/kg on an axial plane passing through the eyes (top), an axial plane passing through the center of the coil and brain (second row), and sagittal and coronal planes passing through the center of the coil and brain (third and bottom rows).