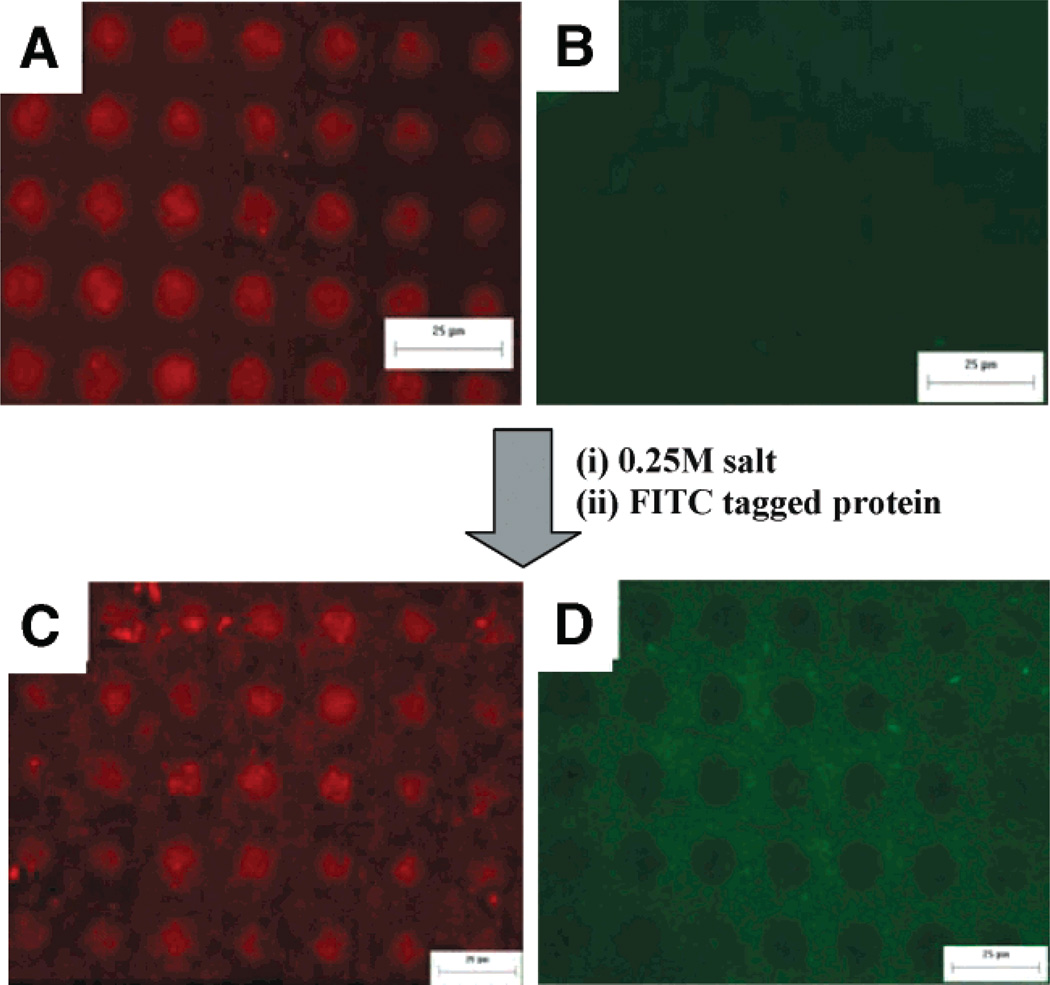
Figure 6.
Fluorescent images of sADH protein attachment on PEG patterns before and after salt treatment: (A, B) sADH tagged with Alexa-Fluoro on the m-dPEG acid patterns before salt treatment, and (C, D) sADH tagged with FITC added onto surface A after salt treatment. A and C are pictures taken using the red channel, while B and D were taken using the green channel.

