Fig. 5.
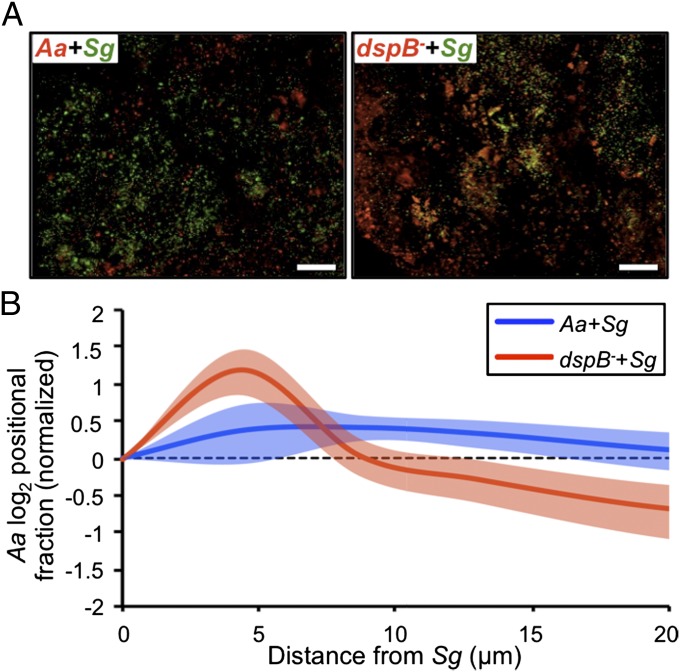
DspB modulates community spatial structure in vivo. (A) Overlays of representative confocal Z stacks from the indicated coinfections. Aa WT (Aa) or dspB− expressing mCherry is red, and Sg expressing GFP is green. Colocalization appears yellow. (Scale bars: 100 µm.) (B) Aa positional fraction is plotted as a function of distance from Sg. Positional fraction here is defined as the proportion of total Aa biomass that is found at each distance away from Sg. Positional fractions have been normalized such that fractions above one (log2 = 0) occur more than expected, whereas fractions below one (log2 = 0) occur less than expected. Continuous lines represent means, shaded regions represent 95% confidence intervals, and the dashed line represents random spatial distribution. Data represent the results for two biological replicates. Each replicate consisted of two to three abscesses, where two to four Z stacks were acquired from each abscess [Aa + Sg (n = 12); dspB− + Sg (n = 16)].

