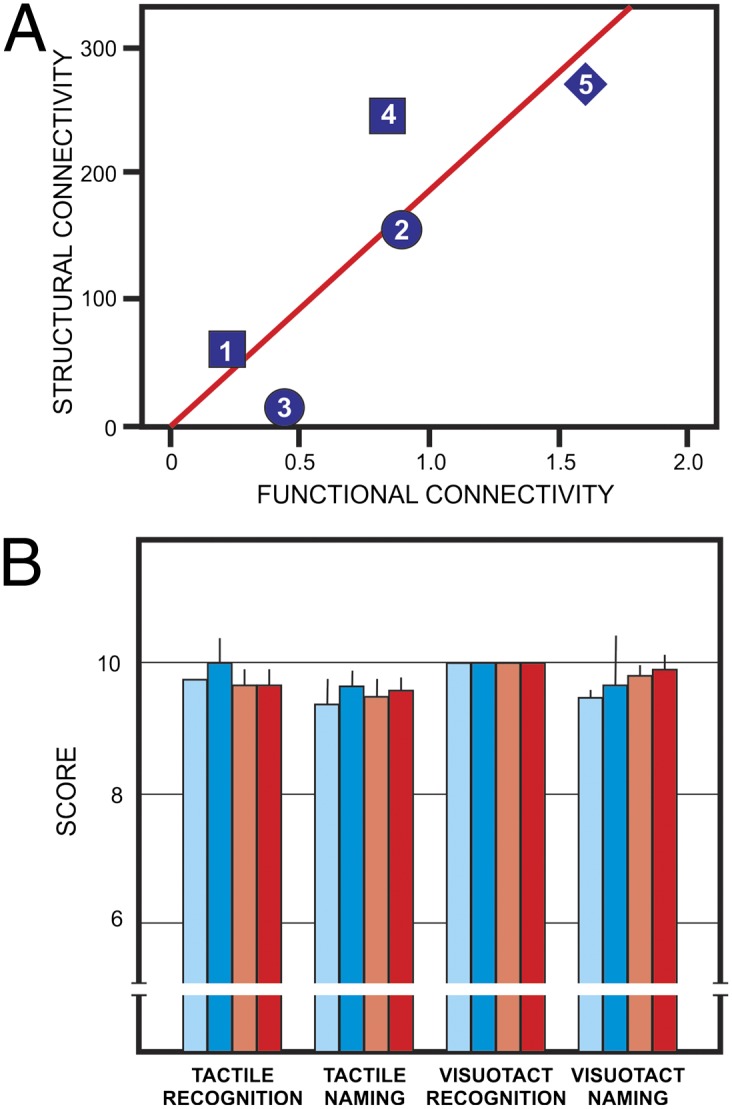
Fig. 4.

Functional and behavioral correlates of structural connectivity. (A) Statistical correlation between structural connectivity (diffusion connectivity values of the aberrant bundles) and rs-fMRI functional connectivity between hemispheres Fisher z-transformed correlation coefficients; r = 0.858; P = 0.03 (one-tailed). One of the patients (CD06) was not included because rs-fMRI data were not available. Numbered symbols denote the different CD morphological phenotypes: squares for partial dysgenesis, circles for agenesis, diamonds for hypoplasia. The numbers correspond to patient numbers in Table S1. (B) Tactile performance of CD subjects (blue bars) compared with neurotypic controls (red bars). Light bars: left hand; dark bars: right hand. Mean + SD. Performance with left vs. right hand was statistically nonsignificant on all tests, as well as that of CD vs. control subjects.
