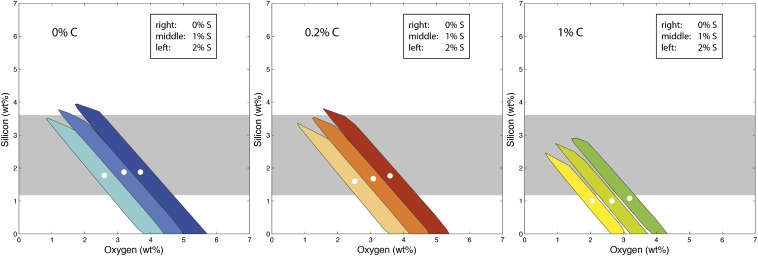
Fig. 3.
Range of O and Si compositions compatible with seismic observations, calculated for varying S and C concentrations. Each panel corresponds to a fixed carbon content: (Left) 0% C; (Center) 0.2% C; (Right) 1% C. In each panel, we calculate three sulfur concentrations: dark (0% S), light (1% S), and lighter (2% S). For each of the nine S–C combinations plotted, we calculate the best numerical fit represented by a white circle. The horizontal gray band represents the outer-core silicon concentration range required by inner-core models (7, 8, 30).

