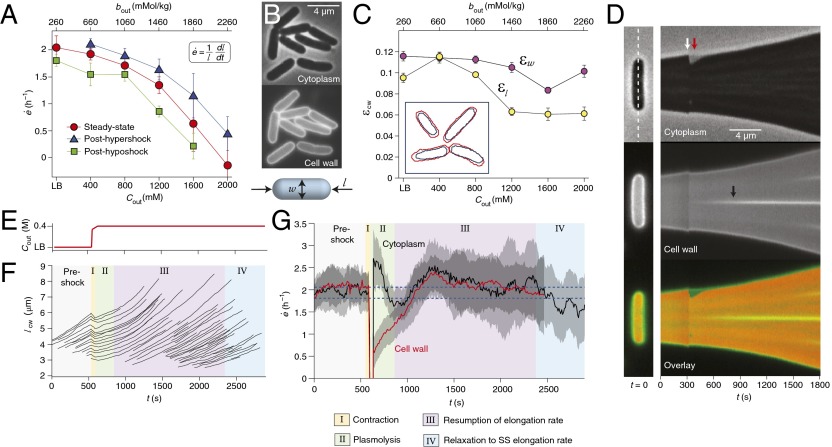
Fig. 1.
E. coli cells maintain their elongation rate after hyperosmotic shock. (A) The population-averaged steady-state elongation rate as a function of the concentration of sorbitol in the growth medium, (red circles). Also shown are the population-averaged elongation rates during phase III of recovery from a 400 mM hyperosmotic shock (blue triangles) and immediately after a 400 mM hypoosmotic shock (green squares). Each data point is averaged over 20–100 cells. Error bars indicate ±1 SE. (Inset) Definition of elongation rate. (B) E. coli stained with fluorescent WGA, imaged with phase and epifluorescence microscopy. (Lower) Schematic defining the length and width of a rod-shaped cell. (C) Longitudinal strain, , and radial strain, , as a function of medium osmolarity. Error bars indicate ±1 SE. (Inset) Tracked outlines of the wall of four cells before (red) and after (blue) plasmolysis. (D) (Left) Initial images of a single cell: phase, epifluorescence, and overlay. In the overlay, the epifluorescence kymograph is false-colored green and the inverse of the phase kymograph is false-colored red. (Right) Kymographs of this cell elongating and dividing during a 400 mM hyperosmotic shock. The kymographs consist of a montage of a one-pixel-wide region around the long axis of the cell, indicated by the dashed line. The white arrow indicates the time of the shock. The red arrow indicates the period of plasmolysis during which the cytoplasm is shorter than the cell wall. The black arrow indicates the formation of a septum during cell division. (E) The concentration of sorbitol in the growth medium versus time during a hyperosmotic shock. (F) The length of the cell walls of representative cells during the same shock. The background colors indicate the four phases of response. (G) The population-averaged elongation rate of both the cytoplasm and the cell wall during the same shock (n = 42 cells). The data were smoothed with a moving-average filter with a 2-min window for illustrative purposes. The blue dotted lines indicate the steady-state elongation rates in LB (upper line) and LB+400 mM sorbitol (lower line). The confidence intervals indicate ±1 SE. The cell wall could not be tracked indefinitely owing to dilution of the cell-wall stain. (Lower) Key describing the four phases of response to hyperosmotic shock.

