Fig. 2.
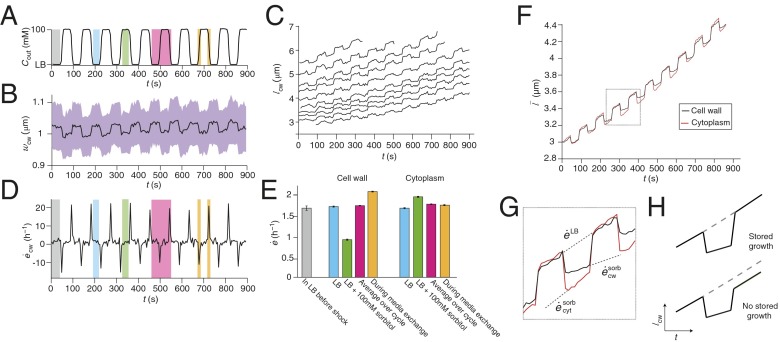
Hyperosmotic shock results in stored growth. (A) The concentration of sorbitol in the growth medium during a 100 mM oscillatory hyperosmotic shock with a 90-s period. The various phases of the oscillatory cycle are highlighted in different colors. (B) The population-averaged width of the cell wall during the shock (n = 37). The confidence intervals (purple region) indicate ±1 SD. (C) The length of the cell walls of representative cells during the shock. (D) The population-averaged elongation rate of the cell wall during the shock. (E) The population-averaged elongation rate of the cytoplasm and the cell wall during each phase of the oscillatory cycle. Error bars indicate ±1 SE. (F) The effective population-averaged length of the cytoplasm and cell wall obtained by integrating their average elongation rate (Materials and Methods). (G) Zoom-in of two cycles from F; dashed lines indicate the elongation rates of the cytoplasm and cell wall in LB+sorbitol ( and , respectively) and in LB (). (H) Schematic illustrating predicted behavior of cell-wall length for two scenarios: (above) hyperosmotic shock reduces elongation rate but growth is stored; (below) hyperosmotic shock reduces elongation rate and growth is not stored.

