Fig. 3.
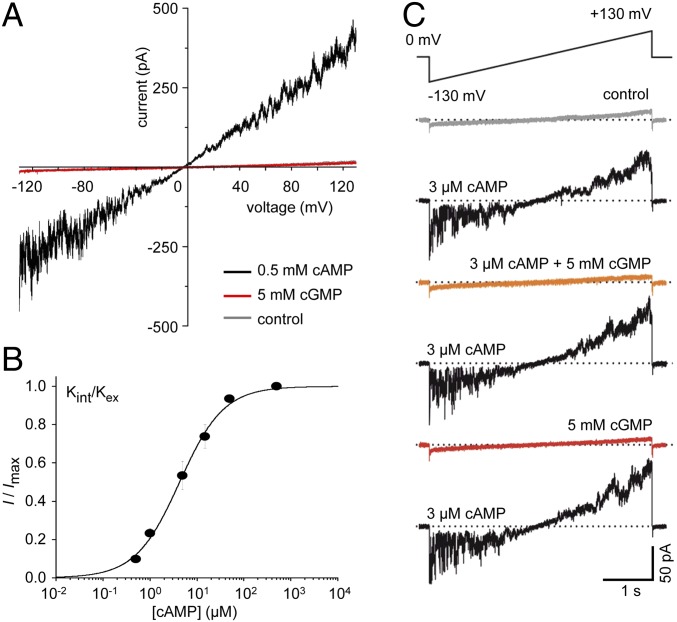
Ligand selectivity in inside-out macropatches. (A) A voltage ramp ranging from −130 to +130 mV in 4.5 s was applied to an inside-out macropatch excised from a SthK-GFP–expressing Xenopus laevis oocyte. The black trace represents the current response after applying 500 µM cAMP at symmetrical potassium. There was no current response after removal of cAMP or applying 5 mM cGMP to the same patch, shown as gray and red traces, respectively. (B) The concentration–activation relationship for cAMP was obtained at symmetrical potassium. Means were calculated from 3 to 14 recordings. Error bars indicate SEM. The black curve is the best fit of the mean values using Eq. S1. When fitting single recordings, we obtained the following: EC50 = 3.68 ± 0.55 µM (n = 10), H = 1.33 ± 0.08 (n = 10). (C) A voltage ramp under similar conditions as described in A was applied to an inside-out macropatch. The representative traces show current responses after applying 3 µM cAMP (black traces), 3 µM cAMP plus 5 mM cGMP (orange trace), or 5 mM cGMP (red trace). The ligands were washed in the same order as shown. There was no current response as long as cGMP was applied.

