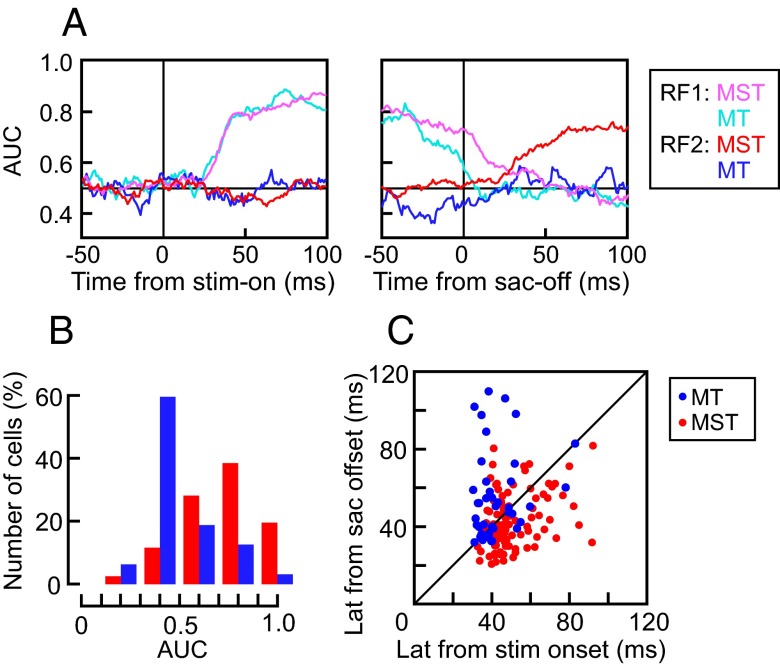
Fig. 5.
Comparison between MST and MT neurons. (A) The time course of the AUC as a classifier for the stimulus in RF1 (MST: magenta; MT: cyan) and RF2 (MST: red; MT: blue). For MST neurons, but not MT neurons, the AUC for RF2 significantly increased after the saccade. (B) Distribution of the mean AUC from 50 to 100 ms after the saccade offset for the 98 MST (red bars) and 41 MT neurons (blue bars). (C) Relationship between the response latencies measured from stimulus onset at RF1 (abscissa) and from saccade offset at RF2 (ordinate) in paradigm I. Note that the latencies of MT neurons (blue dots) from stimulus onset were shorter than MST neurons (red dots), but the latencies of MT neurons from saccade offset were longer than MST neurons.

