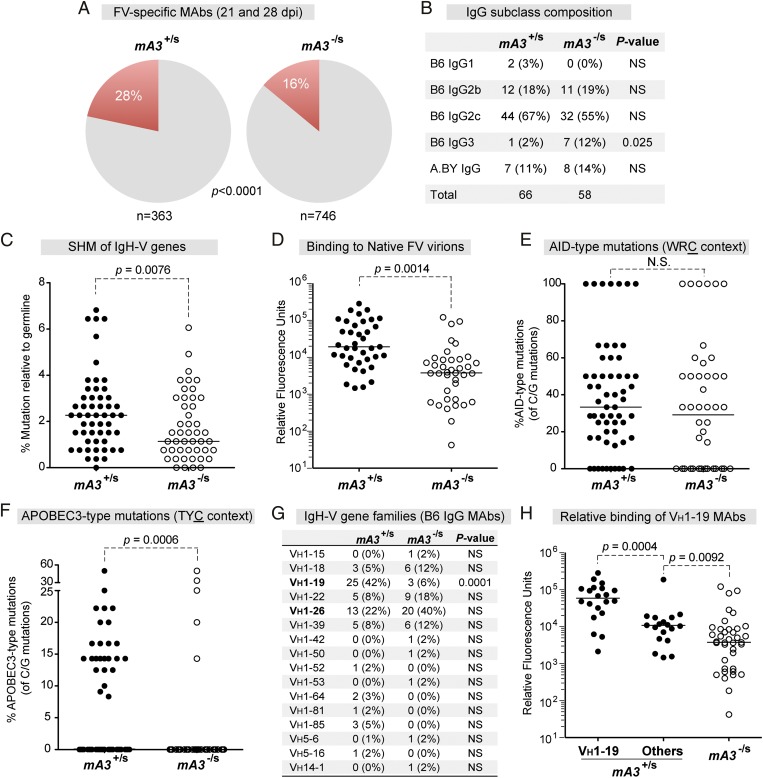
Fig. 1.
Characterization of hybridomas from Rfv3-resistant versus -susceptible mice. (A) FV-specific mAbs from mA3+/s and mA3−/s mice. Hybridomas were derived from splenocytes of FV-infected mice at 21 and 28 dpi. (B) IgG subclass composition of FV-reactive mAbs. (C) Mutation frequency relative to germline. IgG cDNA was sequenced and compared against B6 germline VH sequences. (D) Relative binding of mAbs to native virions at 21 dpi, as evaluated by time-resolved fluorescence ELISA. (E and F) AID (E) and mA3 (F) hotspot mutations. The percentages of WRC or TYC mutations relative to the number of C or G mutations per mAb were calculated, respectively. (G) VH gene distribution. The number of hybridomas belonging to each VH gene family is shown. (H) Data are identical to D, except that mA3+/s mAbs encoding VH1–19 were analyzed separately. In A, B, and G, the difference in percentages was evaluated using Fisher’s exact test. In C–F, median values are shown; differences between the two groups were evaluated using a two-tailed Mann–Whitney U test with P < 0.05 considered significant. NS, not significant.

