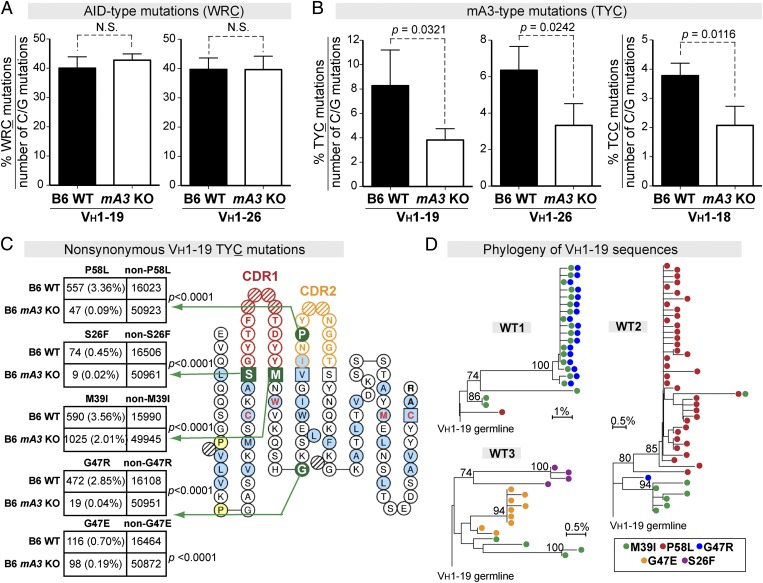
Fig. 3.
mA3 promotes TYC antibody mutations in specific VH genes. (A and B) The percentages of (A) AID hotspot and (B) mA3 hotspot mutations relative to the number of C or G mutations were evaluated in GC B-cell VH genes from WT (n = 3) and mA3 KO (n = 4) mice. Data are shown for VH1–19 and VH1–26, which are the major VH genes in the FV-specific mAb panel in Fig. 1G. The percentage of TCC mutations in VH1–18 is shown in B. Differences were evaluated using a two-tailed unpaired Student t test with P < 0.05 considered as significant. (C) Prevalence of nonsynonymous TYC mutations in WT versus mA3 KO IgH sequences. TYC mutations from B6 WT (n = 16,680 noncollapsed sequence reads from three mice) and B6 mA3 KO (n = 51,096 noncollapsed sequence reads from four mice) sequences were combined, and those sequence reads that resulted in amino acid changes were evaluated in 2 × 2 contingency analyses. (Left) Five nonsynonymous VH1–19 TYC substitutions found in >0.4% of sequence reads in WT mice were compared with sequence reads in KO mice by Fisher’s exact test. Percentages from the entire VH1–19 sequence dataset are shown in parentheses. (Right) IMGT collier-de-perles plot (27) showing the relative positions of the predicted amino acid mutations. (D) Ontogeny of nonsynonymous VH1–19 TYC mutations in individual B6 WT mice. Phylogenetic trees were constructed using the neighbor-joining method, and clades supported with >70% bootstrap are indicated. Each dot within each line corresponds to a unique sequence. Note that M39I was detected in all three mice and that lineages with two TYC mutations could emerge.

