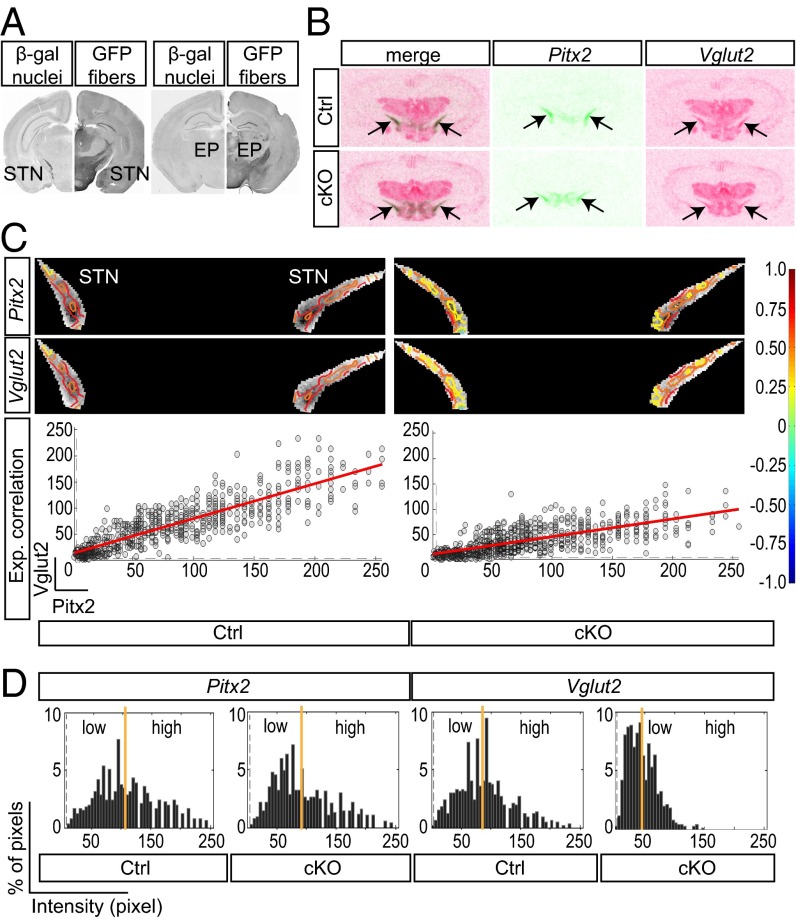
Fig. 1.
The Pitx2-Cre transgene is expressed in the STN and mediates a shift in Vglut2 mRNA levels and distribution. (A) Immunohistochemistry for β-gal (nuclear, Left) and GFP (projections, Right) on coronal mouse Pitx2-CreTau-mGFP sections shows Pitx2-Cre–expressing cell nuclei in the STN (Left) and their projections to the EP (Right) target area. (B) Representative examples of in situ hybridization for Vglut2 (magenta) and Pitx2 (green) mRNA in STN (arrows) of Ctrl (Upper row) and cKO (Lower row), with a merge to the left. (C) Superposition of monochrome in situ images of STN (Pitx2 mRNA, Top row; Vglut2, Middle row) with correlation values indicated according to correlation color scale to the right. mRNA level correlation analysis (Pitx2 mRNA on x axis; Vglut2 on y axis) from representative examples of Ctrl (Left) and cKO (Right). Pearson correlation coefficients for Ctrl and cKO r(Ctrl) = 0.8645 and r(cKO) = 0.71401, respectively. (D) Histograms of quantitative distribution of mRNA intensity; average expression level marked by yellow line, expression detection limit marked by gray dotted line. cKO, conditional knockout; Ctrl, control.

