Fig. 2.
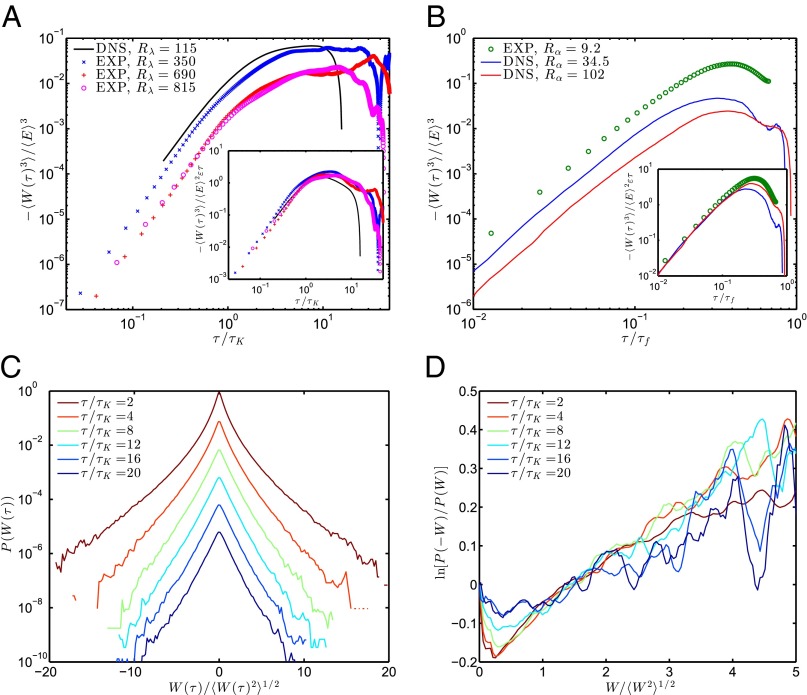
(A) The third moment of energy increments as a function of τ in 3D turbulence for different Reynolds numbers from both experiments (EXP) and direct numerical simulations (DNS). The quantity grows like at short times. The curves obtained at different Reynolds numbers collapse once scaled using [3] (Inset). (B) The third moment of from 2D turbulence experiments. Features similar to 3D turbulence are observed, i.e., is negative and nearly saturates when , where is the characteristic time corresponding to scale (SI Text). (C) PDFs of at different values of τ, in the range, corresponding to 3D experimental flow at . The values of are normalized by their rms values. For clarity, the PDFs have been shifted by a factor of 10 from each other. The PDF tails can be plausibly represented by exponentials. (D) The logarithm of the ratios of the probability of and W as a function of W at different values of τ. The linear prediction of [1], which has been shown to apply in many systems in presence of several thermostats, does not simply apply for turbulence.

