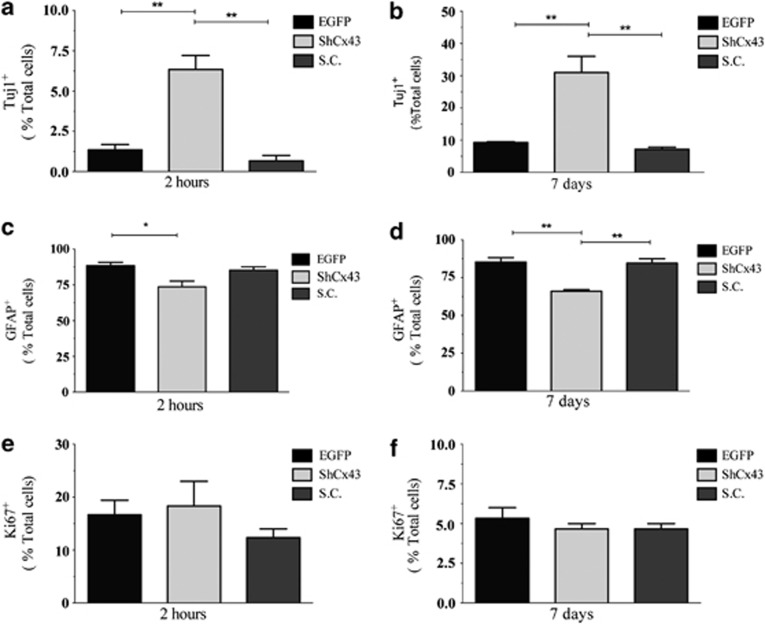
Figure 5.
Quantification of Tuj1, GFAP and Ki67 expression in viral transduced hNPCs. (a and b) Number of Tuj1-expressing cells in 2 h (a) and 7 days (b) differentiated cultures. (c and d) Number of GFAP-expressing cells in 2 h (c) and 7 days (d) differentiated cultures. (e and f) Number of Ki67-expressing cells in 2 h (e) and 7 days (f) differentiated cultures. Values are the means of three independent experiments and error bars represent S.E.M. Values were expressed as % on total cell number. *P≤0.05, **P≤0.01

