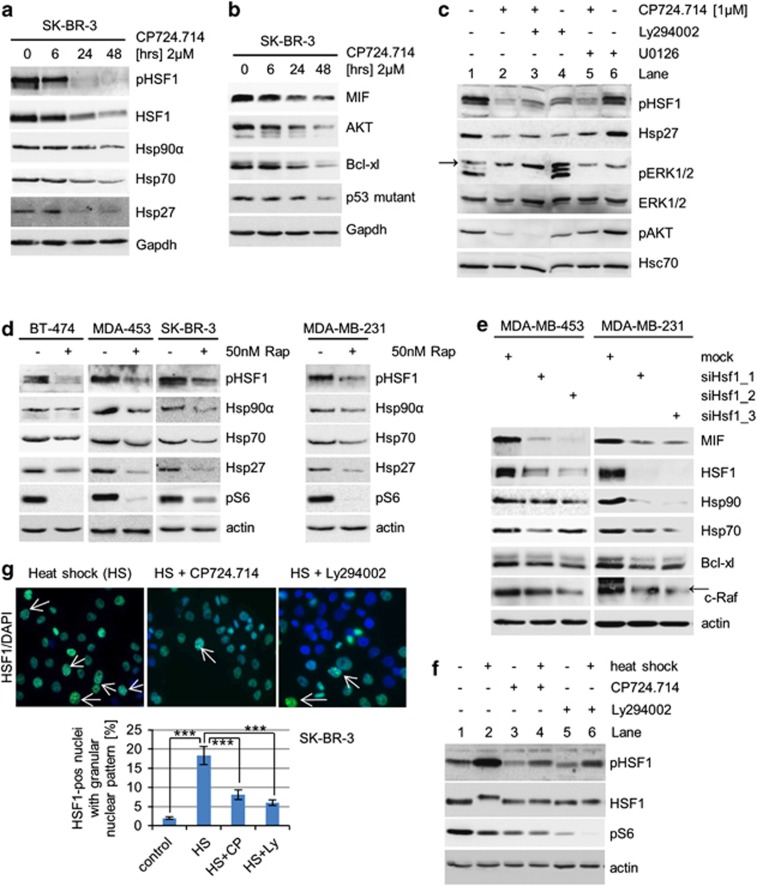
Figure 3.
HER2 inhibition leads to HSF1 inactivation and subsequent inactivation of the HSP90 chaperone. (a and b) Inhibition of HER2 inactivates HSF1 (a) and thereby destabilizes HSP90 clients (b). SK-BR-3 cells were treated with 2 μM CP724.714 for 48 h. Protein levels of pSer326 HSF1, total HSF1, Hsp90α, Hsp70 and Hsp27 (a) and MIF, AKT, Bcl-xl and mutant p53 R175H (b) were assessed by immunoblots. Gapdh, loading control. (c) Inhibition of the HER2–PI3K axis, but not the HER2–ERK1/2 axis, inactivates HSF1 and downstream chaperones. SK-BR-3 cells were treated with 1 μM CP724.714 (specific HER2 inhibitor), 25 μM Ly294002 (PI3K inhibitor) or 10 μM U0126 (MEK inhibitor) alone or in combination as indicated. Immunoblot analysis. Arrow indicates unrelated band. Hsc70, loading control. (d) Inhibition of mTOR prevents HSF1 activation. Cells were treated or left untreated with 50 nM Rapamycin for 48 h. Immunoblot analyses. pS6 serves as functional control of mTOR inhibition. Actin, loading control. (e) HSF1 silencing destabilizes MIF protein. MDA-MB-453 and MDA-MB-231 cells were transfected with different siRNAs against HSF1 for 3 days. Cell lysates were immunoblotted for MIF, panHsp90, Hsp70, Bcl-xl and c-Raf. Representative blots are shown. Actin, loading control. Arrow indicates related band. (f) The heat-shock response is impaired in response to inhibition of the HER2 pathway. SK-BR-3 cells were left untreated or treated with 2 μM CP724.714 or 25 μM Ly294002 for 48 h, followed by heat shock at 42 °C for 1 h where indicated. Protein lysates were prepared after a recovery of 3 h. Immunoblot analysis for pSer326 HSF1 and total HSF1. Note that the HS-induced hyperphosphorylated species of total HSF1 (slower migrating band) is blocked by HER2 and PI3K inhibition. pS6 serves as control for HER2 and PI3K inhibition. Actin, loading control. (g) The heat-shock response is markedly attenuated in response to HER2 inhibition. SK-BR-3 were treated with 2 μM CP724.714 or 25 μM Ly294002 for 48 h. After heat shock at 42 °C for 1 h followed by a 3-h recovery, cells were immunostained for total HSF1 with DAPI counterstain. Top, representative immunofluorescence of heat-shocked control cells and heat-shocked/CP274.714-treated cells. Arrows indicate HSF1-positive nuclei with a granular nuclear pattern. Only those were counted. Bottom, quantification of HSF1-positive nuclei. For every sample, eight random fields ( × 20 magnification) in duplicates were counted. The number of HSF1-positive cells as percent of total nuclei (DAPI stained) is shown. Error bars indicates ±S.E.M. Student's t-test, two-tailed, P-value: ***P<0.001

