Figure 4.
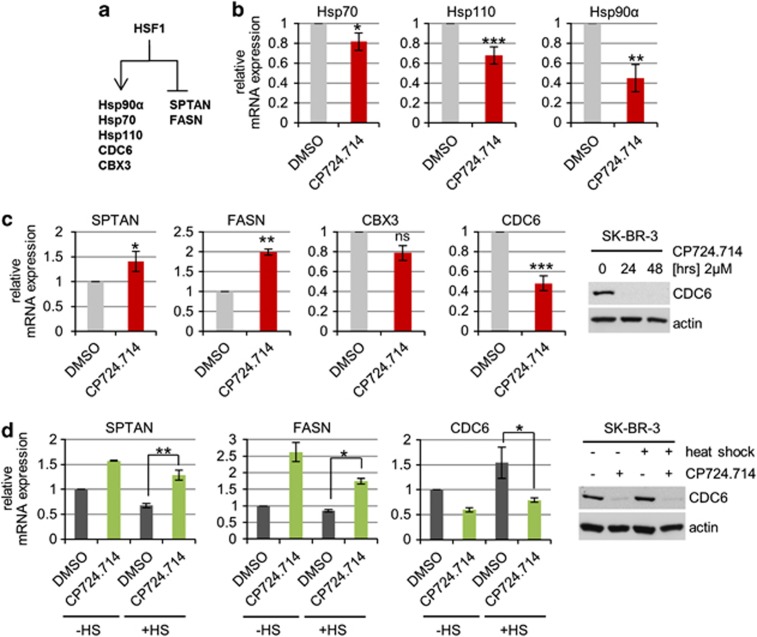
The HSF1 transcriptional program is impaired by HER2 inhibition. (a) Schematic overview of HSF1-regulated gene expression. Transcriptionally activated and -repressed target genes analyzed here are indicated. (b and c) HER2 inhibition impairs the HSF1-dependent inducible heat-shock response (b) and the tumor-promoting (c) transcriptional program of HSF1. SK-BR-3 cells were treated with 2 μM CP724.714 or DMSO for 48 h and mRNA was isolated. qRT-PCR of Hsp70 (*P=0.0396), Hsp110 (***P=0.001), Hsp90α (**P=0.0049), SPTAN (*P=0.0362), CDC6 (***P=0.001), FASN (**P=0.0069) and CBX3 (P=0.067), each normalized to 36B4 mRNA. Relative values are given in (ratio (2−ddCT)). Error bars indicate ±S.E.M. of three independent experiments, repeated twice each with all in triplicates. Student's t-test, two-tailed, P-value: *P<0.05, **P<0.01 and ***P<0.001. (d) HER2 inhibition also attenuates the HSF1-mediated oncogenic program after heat shock. SK-BR-3 cells were treated with 2 μM CP724.714 or DMSO for 48 h. Heat shock (HS) at 42 °C for 1 h with 3 h recovery before mRNA isolation. qRT-PCRs of SPTAN (**P=0.0048), CDC6 (*P=0.0373) and FASN (*P=0.0161), normalized to 36B4. Relative values are given in (ratio (2−ddCT)). Error bars indicate ±S.E.M. of two or three independent experiment in triplicates. Student's t-test, two-tailed, P-value: *P<0.05, **P<0.01 and ***P<0.001

