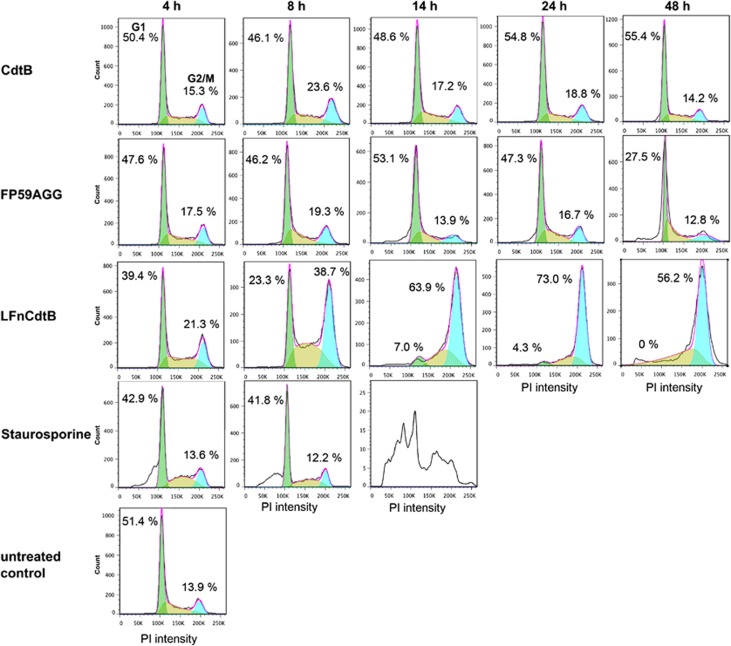
Figure 2.
Cell cycle analysis of CHO K1 cells (0.2 × 10⁶ cells) treated with 250 ng/ml PA and 100 pM CdtB or LFnCdtB or 0.1 pM FP59AGG for 4–48 h. As a control, cells were incubated with 1 μM staurosporine for 4–14 h to induce apoptosis. Cells were fixed with ethanol, stained by propidium iodide to quantify cellular DNA, and 25 000 cells were counted by flow cytometry. Cell cycle analysis by FlowJo software (Flow Jo version 7.6; Tree Star, Ashland, OR, USA) indicated the percentage of cells in the G0/G1 phase (green cell population and percentage on the left side in each panel) and in the G2/M phase (turquois cell population and percentage on the right side in each panel)

