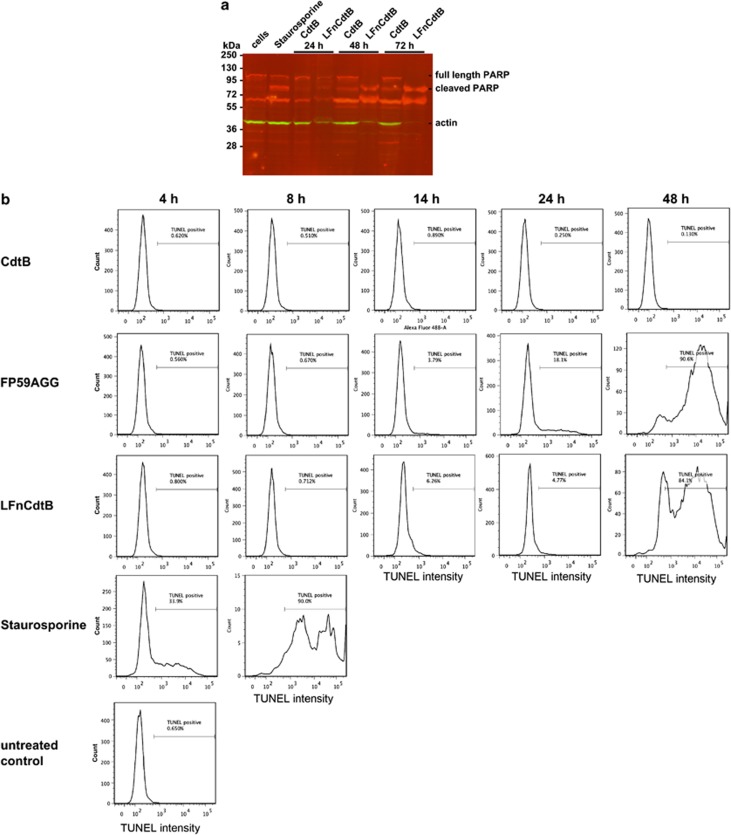
Figure 3.
Apoptosis induction by LFnCdtB analyzed by PARP cleavage (a) and TUNEL staining (b). (a) HeLa cells (1 × 10⁶ cells) were exposed to 250 ng/ml PA and 10 nM LFnCdtB or CdtB for 24–72 h. As a control, cells were incubated with 1 μM staurosporine for 2 h to induce apoptosis. Cells were lyzed and analyzed by simultaneous anti-PARP (red signals) and anti-actin (green signals) immunodetection following western blotting. (b) CHO K1 cells (0.2 × 10⁶ cells) were treated with 250 ng/ml PA and 100 pM CdtB or LFnCdtB or 0.1 pM FP59AGG for 4–48 h. As a control, cells were incubated with 1 μM staurosporine for 4–14 h to induce apoptosis. Cells were fixed with ethanol, stained by TUNEL staining to quantify apoptotic cells, and 10 000 cells were counted by flow cytometry. TUNEL-positive apoptotic cells were gated by high fluorescence and the percentage is indicated in every panel

