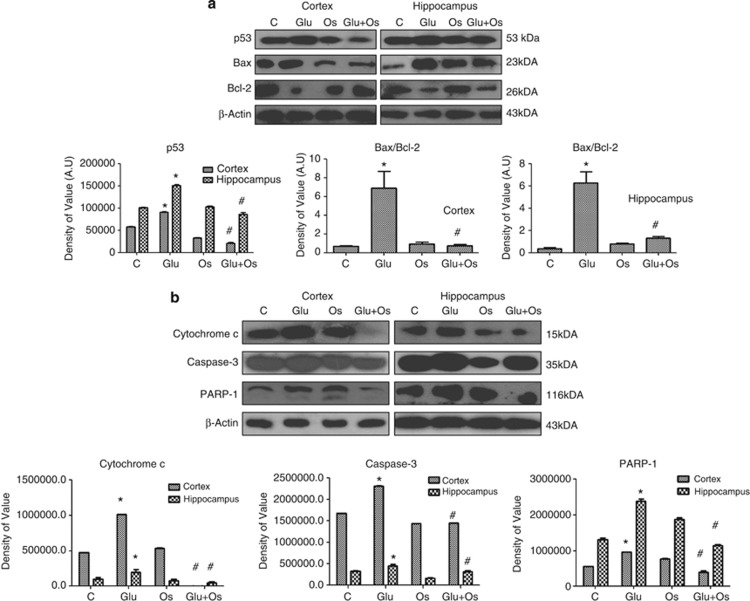
Figure 2.
The effect of osmotin on glutamate-induced neurodegeneration in the cortex and hippocampus of the developing brain. Representative western blots and densitometry histograms showing (a) p53, the Bax/Bcl-2 ratio, (b) cytochrome c, caspase-3 and PARP-1 in the cortex and hippocampus of 7-day-old rats after glutamate and osmotin treatment are shown. Sigma Gel software was used for the quantification of the protein bands. β-Actin was used as a loading control. The density values are expressed in arbitrary units (AUs) as the mean±S.E.M. for the indicated proteins (n=5 rats/group). *Significantly different from the control; #significantly different from glutamate. Significance=P<0.05

