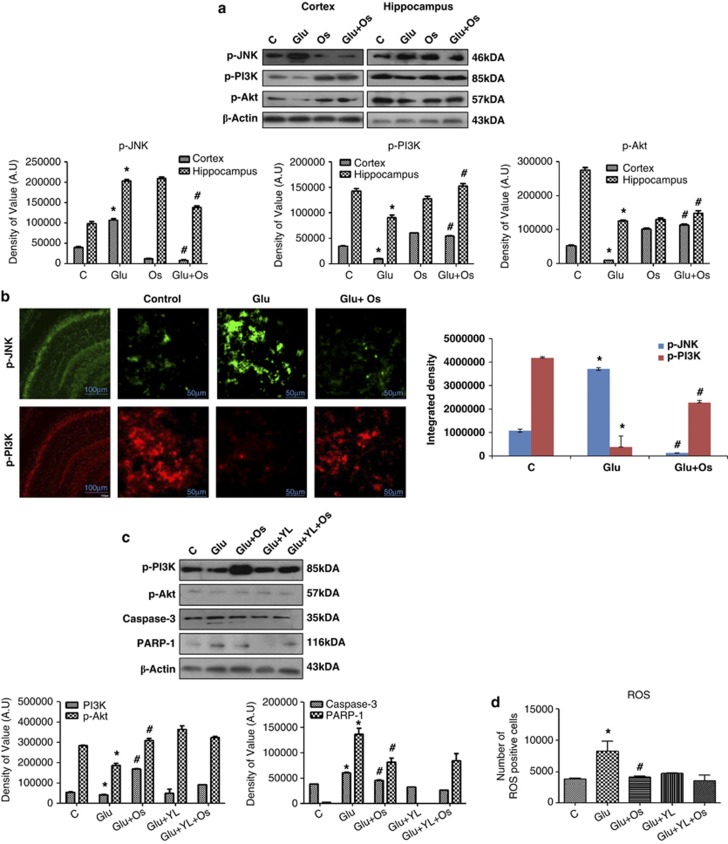
Figure 4.
The effect of osmotin on glutamate-induced intracellular JNK/PI3K/Akt signaling in the cortex and hippocampus of the developing brain. (a) Representative western blots and densitometry histograms of the p-JNK/p-PI3K/p-Akt proteins in the cortex and hippocampus of 7-day-old rats after glutamate and osmotin treatment are shown. Sigma Gel software was used for the quantification of the protein bands. β-Actin was used as a loading control. The density values are expressed in arbitrary units (AUs) as the mean±S.E.M. for the indicated proteins (n=5 rats/group). (b) Localization of phospho-JNK and phospho-PI3K in the hippocampus (CA1) of 7-day-old rats after glutamate and osmotin treatment. Images are representative of the staining observed in each section (n=5 animals/group). The immunofluorescence images indicate the localization of p-JNK (green) and p-PI3K (red). Magnification: × 400, Scale bar: 50 μm. (c) Representative western blots and densitometry histograms of p-PI3K, p-Akt, active caspase-3 and PARP-1 proteins in the hippocampus of 7-day-old rats after treatment with glutamate, osmotin and PI3K inhibitor are shown. (d) Histogram illustrating ROS determination in HT22 cells treated with glutamate, osmotin and PI3K inhibitor in vitro. All the related experimental details are provided in the Materials and Methods section. *Significantly different from control; #significantly different from glutamate. Significance=P<0.05

