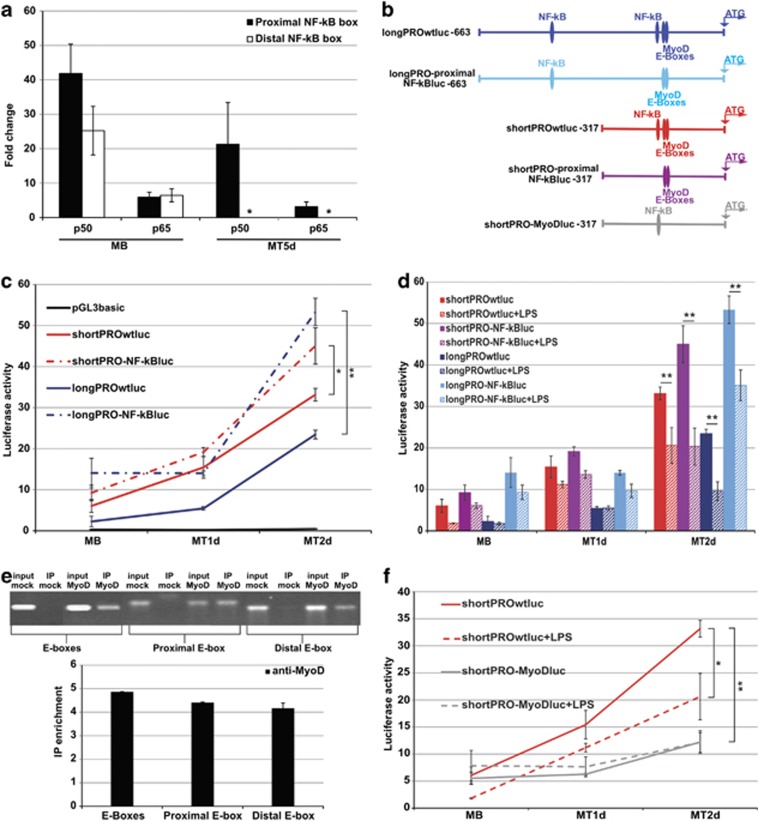
Figure 6.
Ankrd2 expression is negatively and positively regulated by p50 and MyoD, respectively. (a) ChIP with antibodies against p50 and p65 was performed on nuclear extracts from proliferating and differentiating C2C12 cells followed by qRT-PCR using primers spanning the putative NF-κB-binding elements. The bars represent the fold enrichment of p50 and p65 occupancy of the Ankrd2 promoter relative to that of control IgG samples. (b) Graphical representation of the 5′-mouse Ankrd2 promoter region and the conserved portions in the constructs used for transfection experiments. (c) Luciferase activity assay following cotransfection of C2C12 cells with the first four luciferase constructs in (b) and the pGL4.74 control vector. (d and f) Luciferase activity assay in LPS-treated (2 μg/ml LPS for 24 h) compared with untreated cells transfected with the reporter vectors in (b). (e) Following cotransfection of HEK293A cells with FLAG-tagged MyoD and Ankrd2 promoter-driven luciferase vectors, ChIP was performed using anti-FLAG antibody. The immunoprecipitates were analyzed by standard PCR (top) and qRT-PCR (bottom) using specific primers for amplifying regions within the Ankrd2 promoter region containing the proximal or distal MyoD-binding site or both. IPed chromatin from HEK293A cells transfected with FLAG-tagged empty vector (IP mock) represents the negative control. The enrichment of each specific region of the Ankrd2 promoter compared with mock IP DNA was determined by qRT-PCR. All data are represented as mean±S.D. (n=3). MB, proliferating myoblasts, MT, differentiating myotubes at 1, 2, and 5 days (d) after induction. *P<0.05; **P<0.01

