Figure 1.
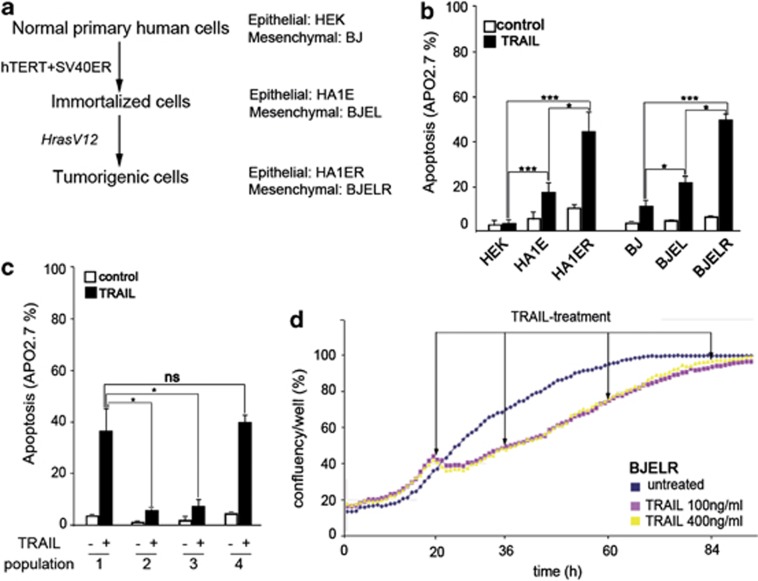
RAS-derived stepwise tumorigenesis models recapitulate TRAIL-tumor-selective apoptosis and display fractional killing and proliferation upon treatment. (a) Scheme representing RAS-derived stepwise tumorigenesis models generated from human foreskin fibroblast (BJ) and human embryonic kidney cells (HEK). Genetic elements introduced for stepwise transformation are indicated. (b) Apoptosis observed in populations of normal, immortalized and RAS-transformed cells derived from HEK and BJ stepwise tumorigenesis models. Basal cell death in untreated populations (control; white bars) and cell death after 16 h of treatment with 1 μg/ml of TRAIL (TRAIL; black bars) is displayed. Apoptosis was analyzed by flow cytometry as the percentage of APO 2.7-positive cells. Histograms represent the mean±S.D. from at least three independent biological replicates. (c) Apoptosis was analyzed as in (b) after 16 h of treatment with 1 μg/ml TRAIL in populations of BJELR-naive cells (population 1), resistant cells obtained from 24 (population 2) or 48 (population 3) hours of pre-exposure to TRAIL (500 ng/ml) and revertant cells (population 4) obtained from a pretreatment of BJELR cells with TRAIL (500 ng/ml) during 48 h, followed by a release from exposure to the cytokine during 12 days before receiving a new dose of 1 μg/ml TRAIL during 16 h. Histograms represent the mean±S.D. from two independent biological replicates, representative of at least three independent experiments. Statistical significance in (b and c) was calculated by applying two-tailed, unpaired Student's t-test, ***P-value<0.0005, *P-value<0.05. (d) Proliferation of BJELR cells upon sequential treatment with TRAIL. Cells were plated and allowed to proliferate during 20 h before receiving a first dose of TRAIL (100 or 400 ng/ml, as indicated), were maintained under continuous exposure to the cytokine and further received sequential treatments at the indicated time points (arrows). Untreated cells were grown in parallel as proliferation controls. Images were acquired every hour using INCUCYTE and confluency was evaluated as the percentage of the surface covered by cells. The mean value obtained from two independent wells per time point is displayed and is representative of four independent biological replicates

