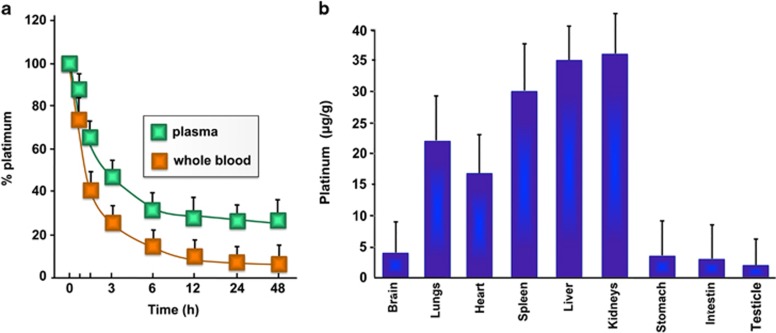
Figure 3.
(a) Variation of percentage Pt dose in blood and plasma with time following the administration of [Pt(O,O'-acac)(γ-acac)(DMS)] intravenously to rat. (b) Tissue distribution of [Pt(O,O'-acac)(γ-acac)(DMS)] in male rats, after 48 h from the intravenous administration. Statistical analyses were performed using one-way ANOVA with a Tukey post hoc test, P<0.05 (compared with control)

