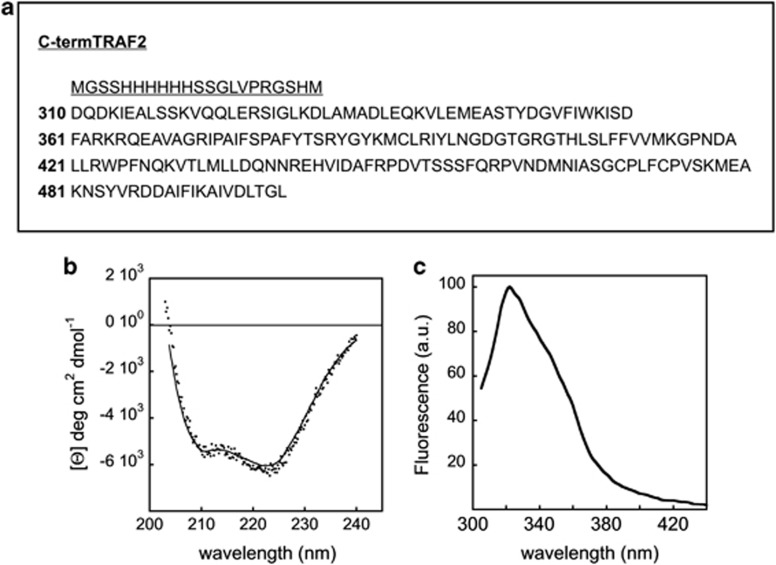
Figure 1.
Structure and spectroscopic analysis of purified TRAF2. (a) Sequence coding for the His-tagged C-terminal domain of TRAF2 (residues 310–501); underlined is reported as the His-tagged sequence. The sequence was cloned into the pET28a(+) (Novagen) expression vector. The resulting plasmid was used to transform E. coli BL21 (DE3) cells. (b) CD spectrum in the peptidic region of the truncated TRAF2 (2 μM). The protein spectrum has the typical features (shape and minima) exhibited by α/β proteins. The spectrum was recorded on a JASCO J-710 spectropolarimeter at 20 °C. (c) Steady-state fluorescence spectrum of truncated TRAF2 (2 μM); excitation was set at 292 nm. The spectrum exhibits a peak around 320 nm, diagnostic of buried tryptophan residues. The spectrum was recorded at 20 °C on the PC1-ISS photon counting fluorometer

