Figure 2.
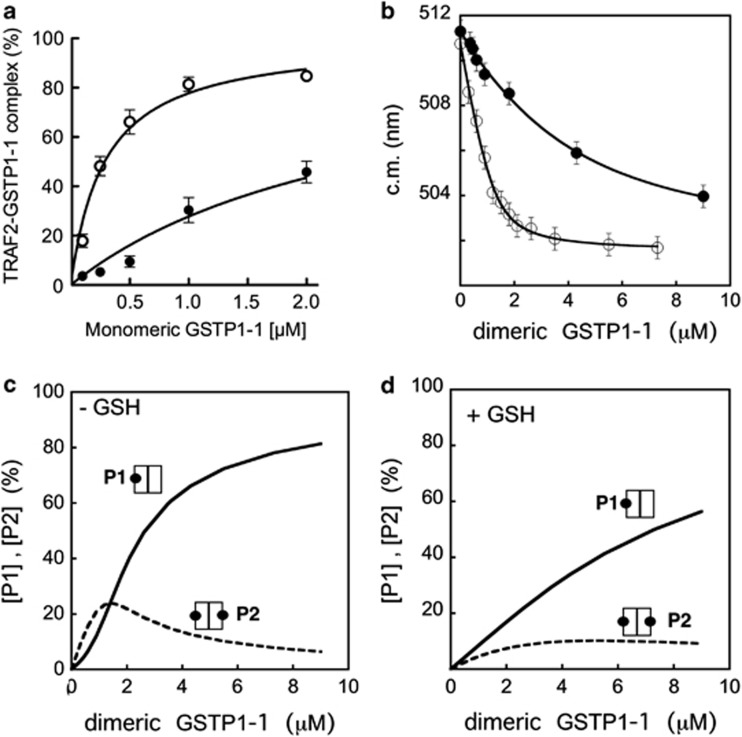
Evidence of the direct binding between TRAF2 and GSTP1-1. (a) ELISA detection of the TRAF2–GSTP1-1 interaction. His-tagged TRAF2 (0.005 μM) was immobilized on Ni-NTA-coated plates and incubated with increasing amounts of GSTP1-1 (from 0.1 to 2 μM (-○-) refers to the concentration monomeric protein). The same experiment was repeated in presence of saturating GSH concentrations (1 mM) (-●-). The curves represent the best fit of data to equation (1) that fulfills the Kd values for the TRAF2–GSTP1-1 complex (Table 2). (b) Fluorometric detection of the TRAF2–GSTP1-1 interaction. Dansylated TRAF2 (2.5 μM) was incubated with increasing amounts of GSTP1-1 (from 0.2 to 9 μM (-○-) refers to the concentration of dimeric protein). The interaction of dansylated TRAF2 (5.9 μM) with GSTP1-1 was also analyzed in the presence of 1 mM GSH (-●-). The curves represent the best fit of data to equation (2) that fulfills the Kd values for the TRAF2–GSTP1-1 complex (Table 2). Each point represents the mean±S.E.M. of at least three different experimental sets. (c) Theoretical dependence of the P1 (one TRAF2 monomer bound to dimeric GSTP1-1) and P2 species (two TRAF2 monomers bound to dimeric GSTP1-1) from the total dimeric GSTP1-1 concentration, assuming a Kd value of 0.3 μM for the TRAF2–GSTP1-1 complex (i.e. in the absence of GSH). (d) The same as (c) assuming a Kd value of 3 μM for the TRAF2–GSTP1-1 complex (i.e. in the presence of GSH)

