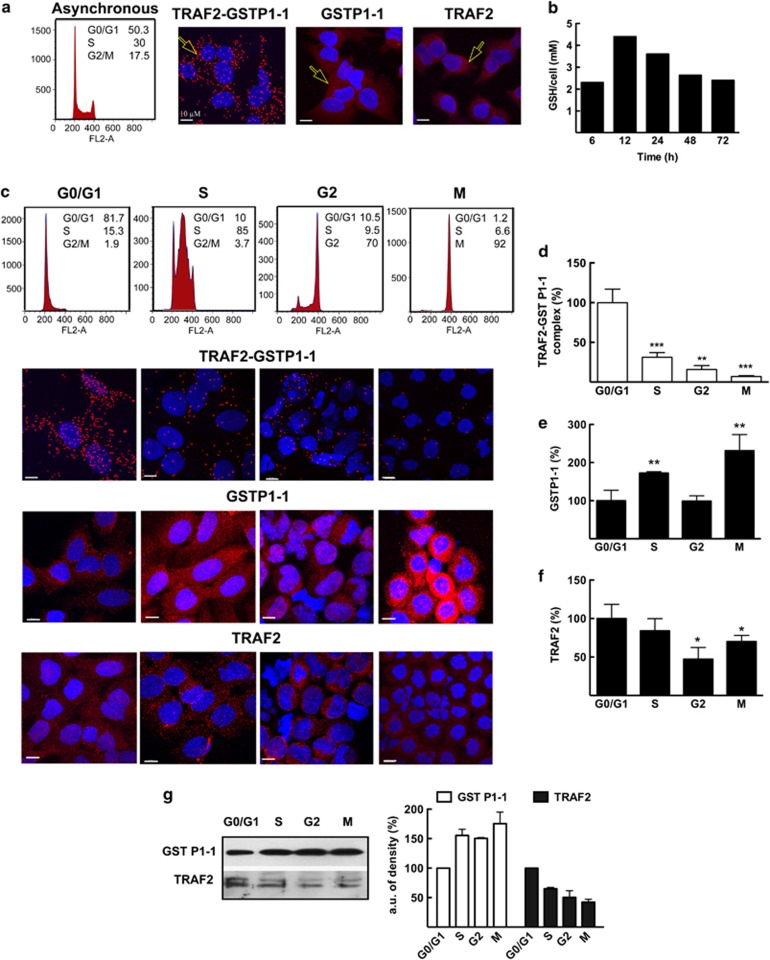
Figure 4.
In situ detection of the TRAF2–GSTP1-1 complex and evaluation of intracellular GSH, GSTP1-1 and TRAF2 levels. (a) Cell cycle analysis and confocal fluorescence imaging of U-2OS cells 24 h after plating. The TRAF2–GSTP1-1 complex was visualized by PLA, which generates red dots when the two proteins are in close proximity (see arrow). GSTP1-1 and TRAF2 were detected with specific primary antibodies and Alexa 647-conjugated secondary antibodies, which generate a diffuse red fluorescence (see arrows). DAPI (blue fluorescence) was used to counterstain cell nuclei. (b) The GSH content of proliferating cells was determined by HPLC analysis. The molar concentration of GSH was obtained using the U-2OS-cell volume of 4000 μm3. (c) Cell cycle analysis and confocal fluorescence imaging of synchronized U-2OS cells. The amount per cell of (d)TRAF2–GSTP1-1 complex, (e) GSTP1-1 and (f) TRAF2 were normalized to the content obtained at the G0/G1 phase. (g) Synchronized cells were also subjected to immunoblot analysis with anti-GSTP1-1 and anti-TRAF2 antibodies. Each point represents the mean±S.E.M. of at least three different experimental sets. *P<0.05, **P<0.005 and ***P<0.0005

