Figure 4.
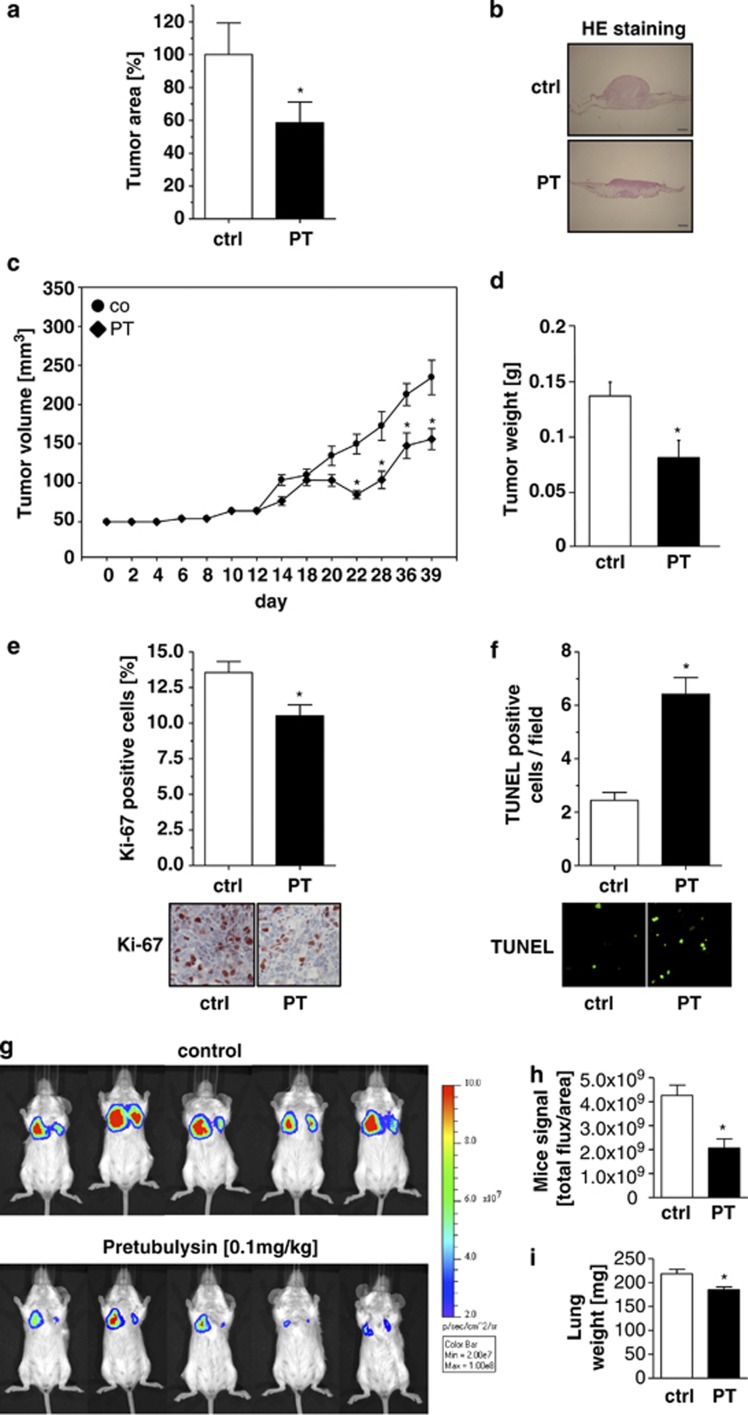
Pretubulysin (PT) inhibits tumor growth and metastasis in vivo. (a and b) CAM model. T24 cells were seeded on the CAM of chicken embryos and treated with 10 nM PT or DMSO for 3 days. Tumor growth was determined using hematoxylin and eosin (HE)-stained paraffin sections of the CAM as described in Materials and Methods. (a) Analysis of tumor area, described as percentage of the untreated control group with mean±S.E.M. of three independent experiments (*P<0.05), demonstrates the growth inhibitory impact of PT. (b) Representative pictures of hematoxylin and eosin-stained sections of the CAM are shown; scale bar: 500 μm. (c–f) In vivo xenograft model. MDA-MB-231 breast cancer cells were injected subcutaneously in SCID mice. When tumors had established, mice were treated with 0.1 mg/kg PT every second day. (c) Tumor volume as well as (d) tumor weight was significantly reduced in PT-treated mice compared with control animals. (e) Staining of tumor tissues of PT-treated mice revealed significantly diminished Ki-67-positive cells in comparison with control mice; *P≤0.05 (one-way analysis of variance (ANOVA) Holm–Sidak). (f) TUNEL staining demonstrated an increased number of apoptotic cells per microscopic field in PT-treated mice in comparison with controls. (g–i) In vivo cancer metastasis model. BALB/cByJRj mice were pretreated with 0.1 mg/kg PT or solvent control. (g) Bioluminescence signals were recorded by imaging dorsoventral and ventrodorsal sides of the mice on day 8 after intravenous injection of 4T1-Luc cells intravenously. Five representative mice out of 8 or 10 treated animals, respectively, are shown. (h) Luciferase signals were calculated as photons/s/cm2 (total flux/area). (i) The weight of the lungs isolated from PT-treated BALB/cByJRj mice on day 8 is significantly reduced compared with lung weights of control mice; *P≤0.05 t-test. Ctrl, control

