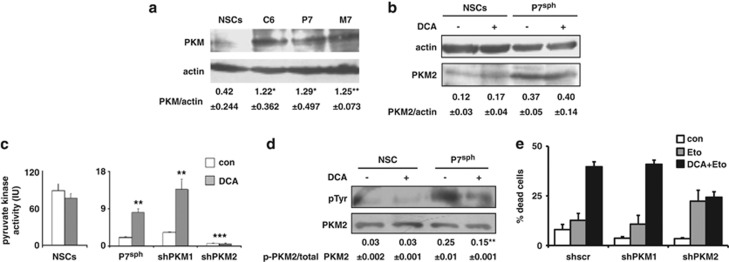
Figure 1.
Difference between rat neural and glioma stem cells in the expression of PKM2 and regulation by DCA. (a) PKM expression was assessed in rat NSCs or glioma spheroids (sph) by immunoblot using an antibody, which recognizes both M1 and M2 isoforms. The blot shown is representative of three independent experiments. Quantifications are indicated as ratio±S.D. of PKM/actin. *P<0.05; **P<0.01. (b) PKM2 expression was assessed in control or DCA-treated (1 mM, 48 h) NSCs or glioma spheroids using a specific anti-PKM2 antibody. The blot shown is representative of three independent experiments. Quantifications are indicated as ratio±S.D. of PKM2/actin. (c) The effect of DCA treatment (1 mM, 48 h) on pyruvate kinase activity was measured in NSCs and in glioma spheroids treated with the indicated shRNA designed to target PKM1 or PKM2. **P<0.01; ***P<0.001. (d) PKM2 was immunoprecipitated from NSCs or glioma spheroid lysates in control or DCA-treated conditions. The presence of PKM2 and its phosphorylation were determined by anti-phosphotyrosine (pTyr) and anti-PKM2 antibodies, which were detected using western blot. The blot shown is representative of three independent experiments and the values below are the mean±S.D. of the phosphotyrosine intensity determined by densitometry and normalized to total PKM2 intensity (**P<0.01). (e) Glioma spheroids treated with sh-scr or shRNA targeting either PKM1 or PKM2 were incubated with etoposide (Eto 50 μg/ml, 12 h) or DCA (1 mM, 48 h)+etoposide. The percentage of dead cells was determined by the Trypan blue dye vital staining

