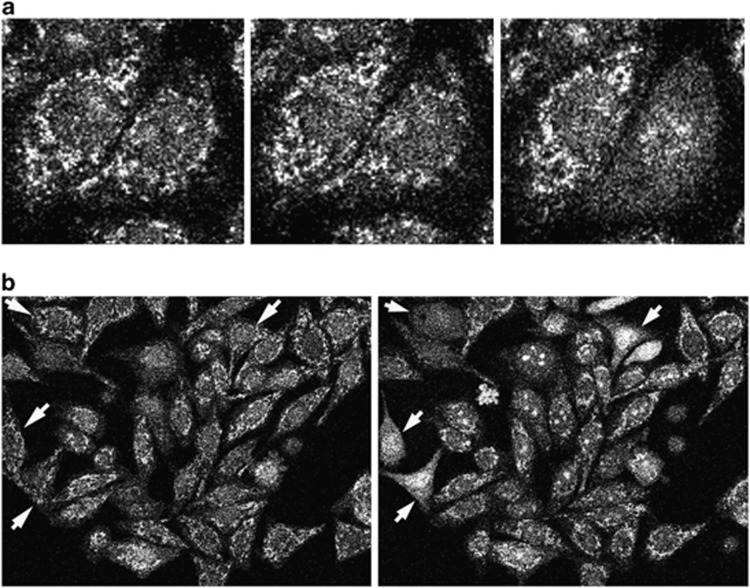
Figure 5.
PepPuma expression results in cytochrome c release from the mitochondria. (a) Shown are three time points in the process of apoptosis. In the left-hand panel, both cells in the main field of view have their mitochondria intact. In the central panel, the right-hand cell is starting to undergo apoptosis with mitochondrial membrane permeabilisation leading to the GFP signal becoming more diffuse. In the right-hand panel, the right-hand cell has completely lost mitochondrial integrity and GFP–cytochrome c has translocated to the nucleus. (b) White arrows indicate cells before (left panel) and after (right panel) mitochondrial permeabilisation

