Fig. 3.
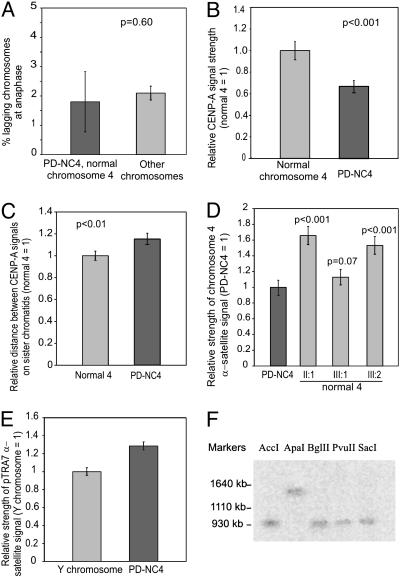
(A) Histogram comparing the rate of lagging for combined PD-NC4 and chromosome 4 at anaphase after nocodazole treatment with that for all other chromosomes. (B) Intensity of CENP-A signal on PD-NC4 (normalized to 1) as detected by immunofluorescence compared with that of the normal chromosome 4. (C) Distance between CENP-A signals on sister chromatids for PD-NC4 and normal chromosome 4 (normalized to 1). (D) Intensity of chromosome 4-specific α-satellite signal (p4n1/4) on PD-NC4 (normalized to 1) and normal chromosome 4 in each of the three PD-NC4 carriers. Variation between different chromosomes 4 represents normal polymorphic variation between homologous centromeres. (E) Relative intensity of pan-α-satellite signal (pTRA7) on PD-NC4 (normalized to 1) and the Y chromosomes in the two male individuals carrying the PD-NC4. (F) Sizing of Y-chromosome α-satellite DNA in individual III:1 using pTRA7 after PFGE. The α-satellite generates a single band of 950 kb when digested with enzymes AccI, BglII, PvuII, and SacI.

