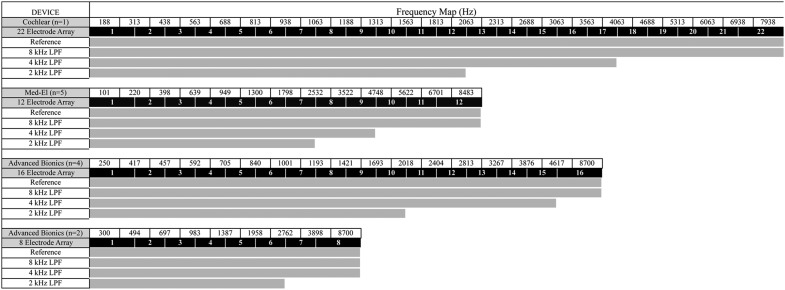
Figure 1.
Average electrode frequency maps for cochlear implant (CI) users
Note: Within the speech processor, the incoming acoustic wave is band-pass-filtered into separate channels so that each electrode can later receive a specific frequency range of the original signal. The electrode map shown here indicates the average frequency range assigned to each electrode for CI participants of this study. Maps are separated by implant manufacture and number of physical electrodes within the array. The gray-scale bars represent anticipated electrode stimulation for each stimulus version. Electrically, there is little difference between the reference and 8-kHz LPF (low-pass-filtered) versions, and greater differences are anticipated for the 4- and 2-kHZ LPF versions.

