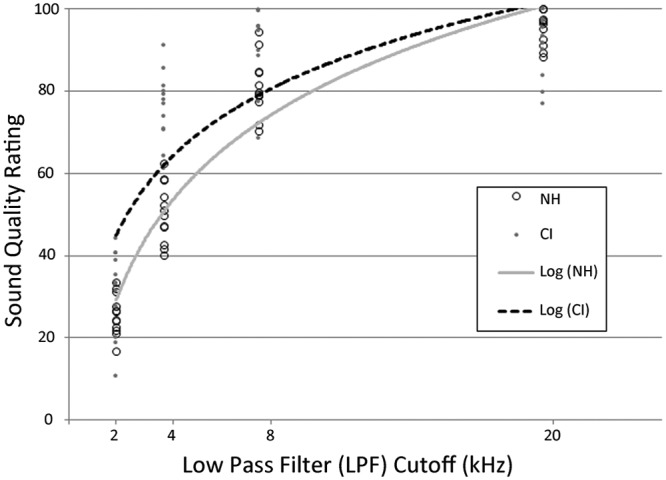
Figure 4.

Logarithmic regression analysis of mean sound quality rating versus low-pass-filter (LPF) cutoff (kHz) by group
Note: NH = normal hearing; CI = cochlear implant. Data points correspond to average sound quality ratings for a stimulus version for one participant (best-fit line for NH listeners: Y = 31.1 × Ln(x) – 207.3, r2 = .92; best-fit line for CI users: Y = 24.6 × Ln(x) – 142.0, r2 = .75).
