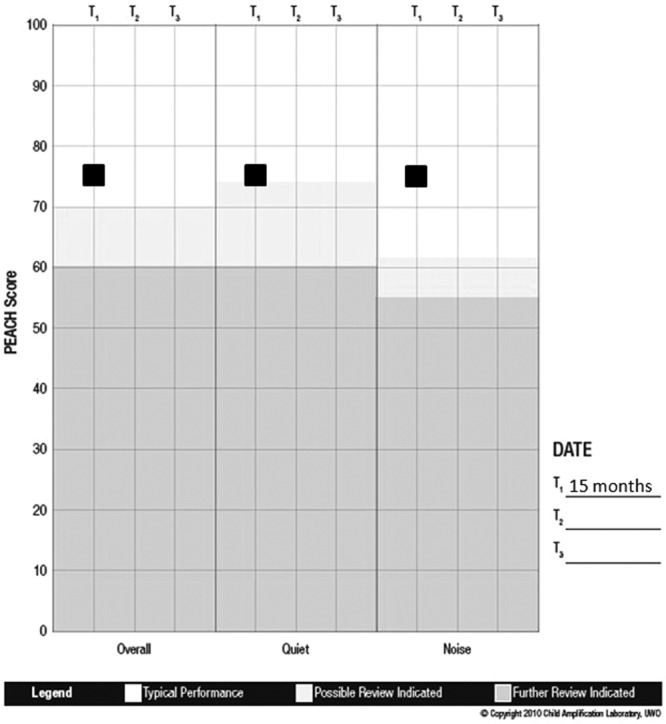
Figure 12.

PEACH score sheet for case example: Michael
Note: The PEACH percentage scores (y-axis) are plotted within each subscale (x-axis) for this case example. Results indicate that Michael is demonstrating typical auditory performance while wearing the hearing aids.
