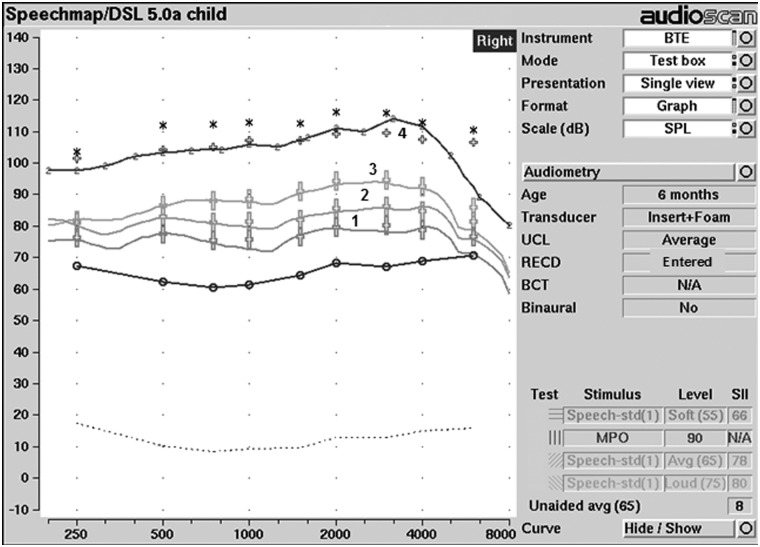
Figure 2.
SPLogram display of hearing instrument performance in relation to pediatric DSL v5.0a targets for a child with a PTA of 52 dB HL
Note: The solid lines represent the output of the hearing instrument for soft (1), average (2), loud (3) speech inputs and MPO (4) in relation to the various speech targets (large +) and MPO targets (small +). Thresholds (o) and upper limits of comfort (*) are also displayed.

