
Figure 3.
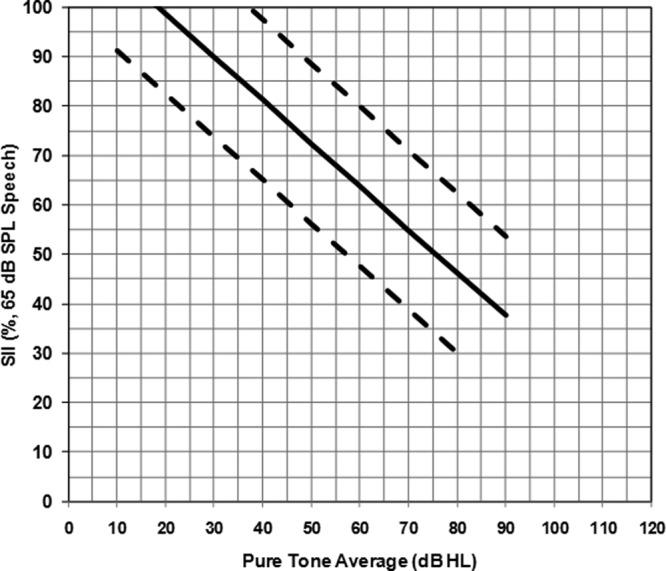
Graph from the Aided SII Normative Values Worksheet displaying SII values for a 65 dB speech input
Note: The regression line was obtained from hearing aid fittings on 161 ears of infants and children. The solid line represents the linear fit to the data and the dashed lines represent the upper and lower 95% confidence interval ranges. An SII value that falls between the dashed lines is considered to be typical audibility for that pure tone average.