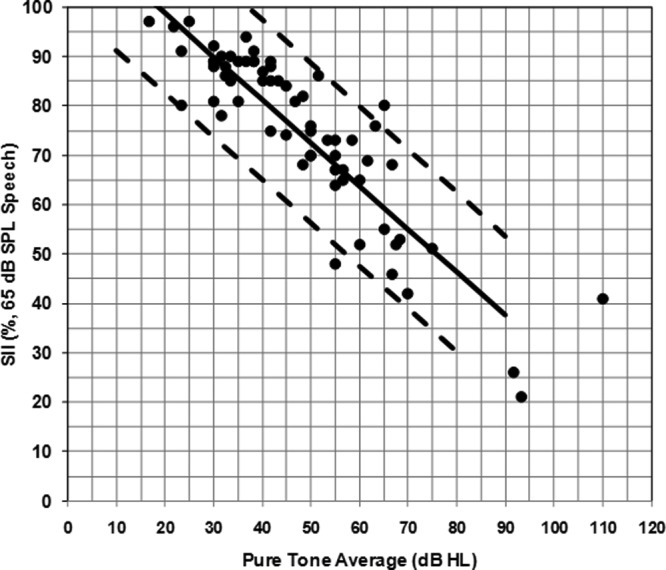
Figure 4.

SII values for average speech inputs by PTA for children with hearing aids involved in this study (filled circles)
Note: Solid and dashed lines are from the Aided SII Normative Values Worksheet. The solid line is the average SII normative values and the dashed lines are the upper and lower 95% confidence interval ranges.
