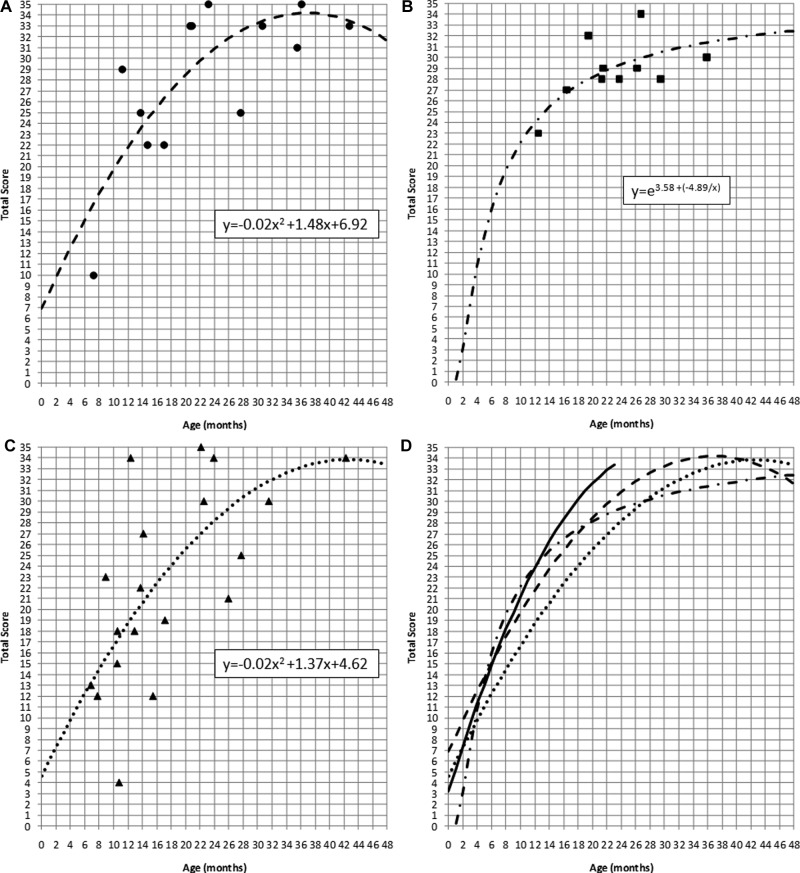
Figure 7.
LittlEARS scores (y-axis) by age (x-axis) and regression lines from children with hearing aids who (a) are typically developing and have no comorbidities or complex factors (filled circles); (b) have mild to moderate comorbidities (filled squares); and (c) have complex factors (filled triangles)
Note: The various lines indicate the regression for each set of data: (a) large dashed; (b) dotted-dashed; and (c) small dashed. Regression equations are noted within each figure. The fourth panel (7d) displays all regression lines on a single graph and compares them to the average normative values (solid line).

