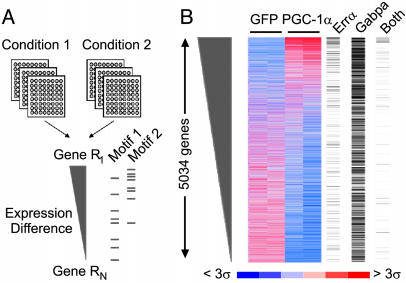
Fig. 1.
Schematic overview of motifADE and application to the PGC-1α time course. (A) The motifADE strategy. It begins with a list of genes ordered on the basis of differential expression across two conditions. Each gene is then annotated for the presence of a given motif in the promoter region. A nonparametric statistic is used to assess whether genes with the motif tend to rank high on this list. In this example, genes with Motif 1 are randomly distributed on the list, whereas genes with Motif 2 tend to rank high, suggesting an association between Motif 2 and the differential expression. (B) C2C12 cells were infected with an adenovirus expressing either GFP (control) or with PGC-1α and were profiled over a 3-day period. Experiments were performed in duplicate and relative gene expression measures are shown. Genes are ranked according to the difference in expression between PGC-1α and GFP on day 3. Mouse genes having a perfect Errα motif (5′-TGACCTTG-3′), a perfect Gabpa/b motif (5′-CTTCCG-3′), or both motifs are labeled with a black bar on the right side of the correlogram.

