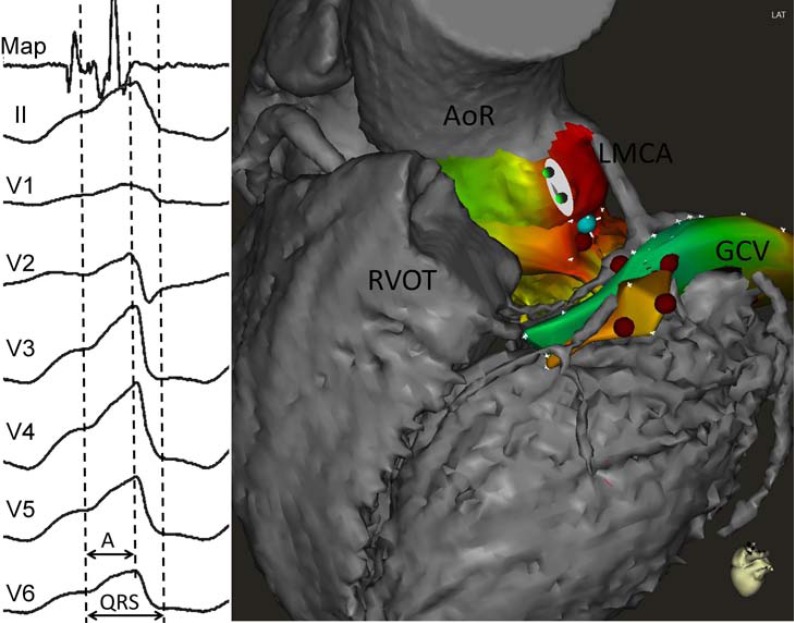
Fig. (2).
Example of idiopathic ventricular tachycardia (VT). Electrocardiogram (left panel) shows a maximum deflection index (MDI) of 0.71 (interval A divided by QRS duration). However, radiofrequency application (right panel, red dots) in the distal great cardiac vein (GCV) failed to eliminate VT. In this case MDI was not useful to predict an epicardial origin of the VT. Mapping in the aortic root (AoR) showed the earliest bipolar electrogram ("Map" in the left panel, blue dot in the right panel) in the left cusp. LMCA, left main coronary artery; RVOT, right ventricular outflow tract.

