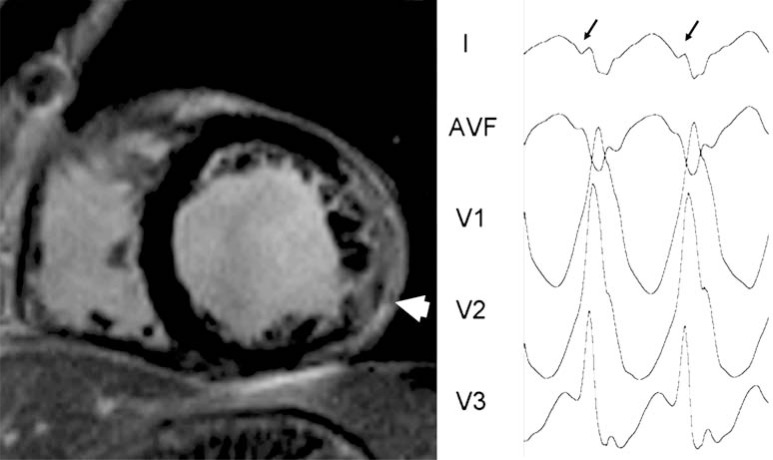
Fig. (4).
Epicardial VT in nonischemic cardiomyopathy. Left panel shows short axis view of contrast-enhanced cardiac magnetic resonance from a patient with non-ischemic cardiomyopathy. An extensive area of hyperenhancement is observed in the lateral wall of the left ventricle (white arrow). Right panel shows the electrocardiogram of the clinical ventricular tachycardia. Q waves (lead I, black arrows) represent the initial forces of the ventricular activation going from epicardium to endocardium.

