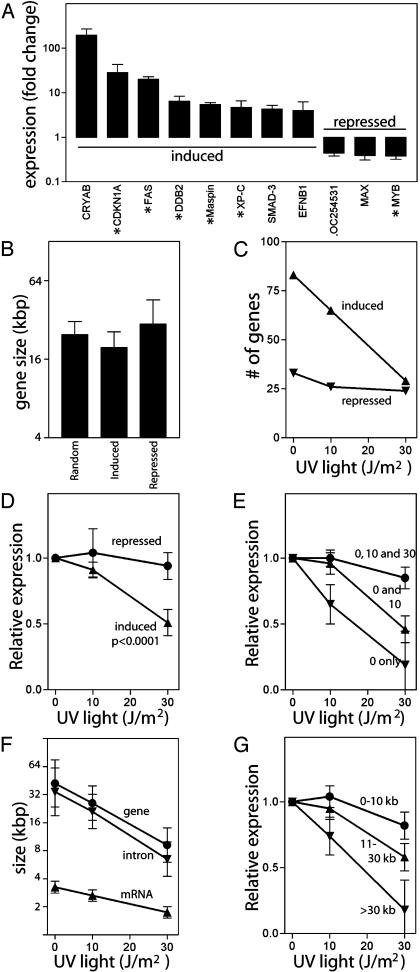
Fig. 1.
The effect of UV light on expression of genes induced at the permissive temperature. (A) Fold increase in gene expression at the permissive temperature was determined by real-time RT-PCR. Known p53-regulated genes are denoted with asterisks. (B) The mean size of genes induced or repressed at the permissive temperature compared to the size of randomly selected genes. The effect of the UV light on the number (C) and expression (D) of genes induced or repressed at the permissive temperature. Expression in D for each gene was determined and normalized to the induced level of expression of that gene at the permissive temperature alone and is expressed as the mean level of expression determined from all genes in the group. (E) Genes were grouped by behavior to UV light: induced at 0 (inverted triangle), 0 and 10 (triangle), or 0, 10, and 30 (circle) J/m2. Relative expression was determined as indicated in D. (F) The mean size of loci (circles), mean size of mRNA (triangles), and the total intron size (inverted triangles) are indicated for each group in E. (G) Genes were sorted into three groups by gene size (≤10 kb, 11-30 kb, and >30 kb, n = 28, 26, and 27, respectively) and the mean effect of UV light on gene expression in each group was determined. Error bars in A and D-G indicate the 95% confidence interval of the indicated mean. The P value in D was determined by one-way ANOVA.

