
Figure 3.
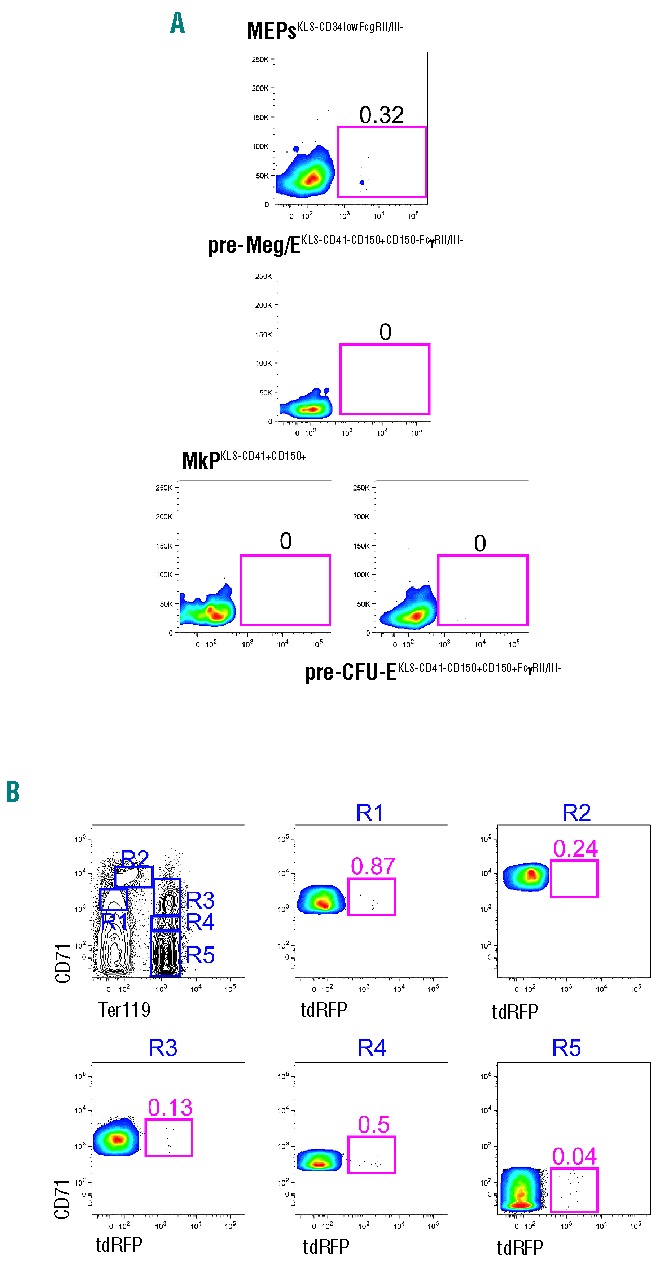
Ltf-reporter mice do not label erythroid cells. (A) (From top to bottom) proportion of tdRFP+ (I) MEPs as defined by gating on lin−/c-kit+/Sca-1−(KLS−)/CD34low/FcγRII/III−, (II) pre-Meg/Es as defined by KLS−/CD41−/CD150+/CD105−/FcγRII/III−, (III) MkPs as defined by KLS−/CD41+/CD150+ and (IV) pre-CFU-Es as defined by KLS−/CD41−/CD150+/CD105+/FcγRII/III+ cells. (B) tdRFP expression in erythoid precursors as determined by differential CD71 and Ter119 co-expression. One representative FACS plot out of 12 showing BM cells is depicted.