
Figure 1.
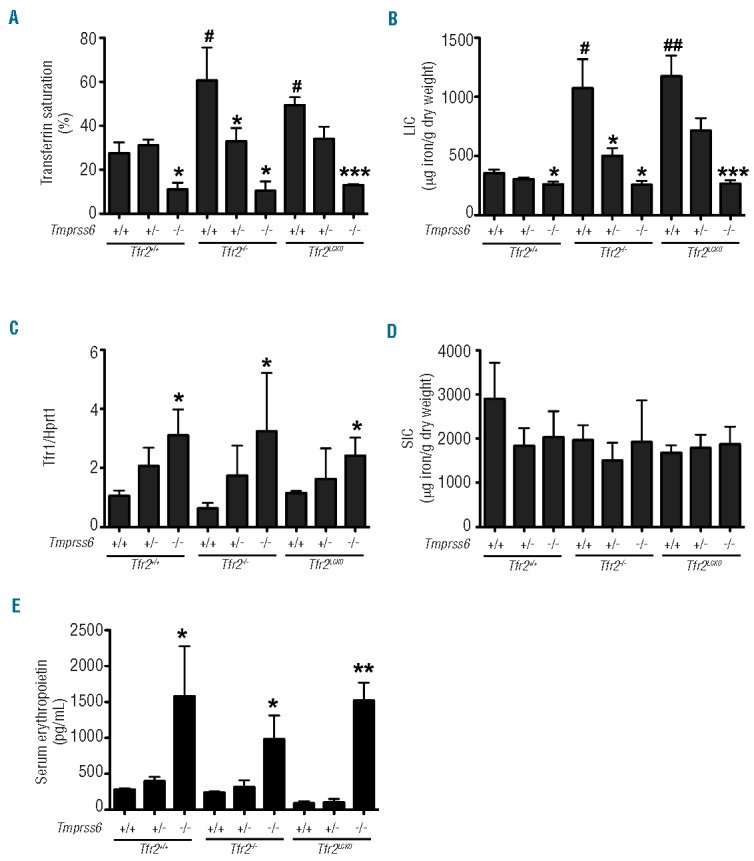
Effect of Tmprss6 deletion on iron parameters and serum erythropoietin levels of Tfr2−/− and Tfr2LCKO mice. The graphs show transferrin saturation (A); hepatic non-heme iron content (LIC) (B); liver mRNA expression of transferrin receptor 1 (Tfr1)(C); splenic non-heme iron content (SIC)(D); serum erythropoietin levels (E) in all genotype combinations analyzed. Mean values of three to six animals per genotype are shown and error bars indicate the standard deviation. Symbols refer to a statistically significant difference: *P<0.05, **P<0.01 and ***P<0.005 respective to the relative Tmprss6+/+ control of each Tfr2 genotype; #P<0.05 and ##P<0.01 respective to wild-type (Tmprss6+/+Tfr2+/+) controls. For the complete statistical analysis see Online Supplementary Table S2.