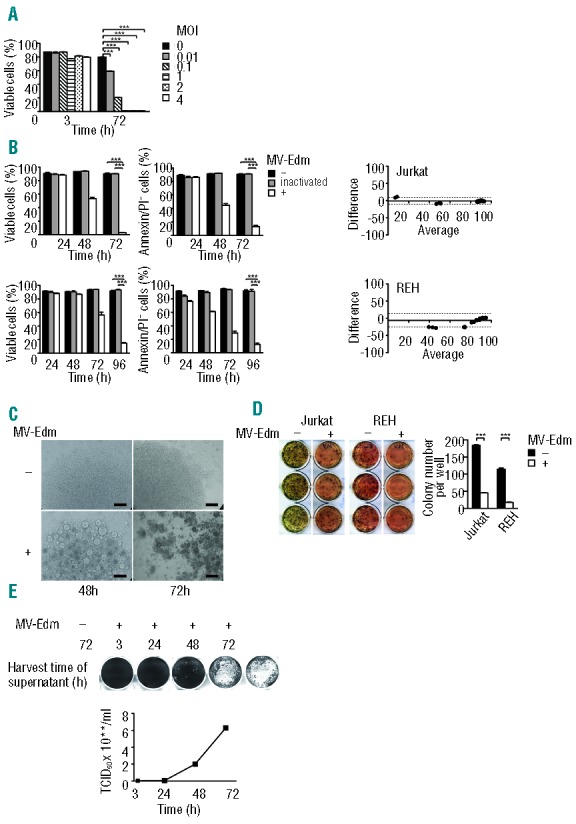
Figure 1.

MV-Edm effectively replicates in and kills ALL cell lines (A) Dose-dependent killing of Jurkat cells. Jurkat cells (4 × 10⁴ cells per well in a 96-well plate) were infected with MV-Edm at increasing MOIs. Cell viability was determined at 3 h and 72 h by FACS using FSC/SSC analysis. Results are means +SD of triplicates and are expressed as percentage of total cells. Similar results were obtained in 2 independent experiments. (B) Time-dependent killing of Jurkat and Reh cell lines. 4 × 10⁴ cells per well were incubated with MV-Edm at a MOI of 1 (“+”), with heat-inactivated MV-Edm (“inactivated”) or with medium (“−“). Cell viability was determined by FSC/SSC analysis (left panels) and Annexin V/PI staining (middle panels). Results are means +SD of triplicates and are expressed as percentage of total cells. Agreement between forward/side scatter and Annexin V/PI analyses was determined using Bland-Altman plots (right panels). Mean difference (bias) is indicated by a solid line, ± 1.96 standard deviations of the differences (95% limit of agreement) by dashed lines. Average denotes average of results of both methods. Similar results were obtained in 3 independent experiments. (C) Formation of syncytia in Jurkat cells. Jurkat cells were seeded in 96-well plates (4 × 10⁴ cells per well in a 96-well plate) and infected with MV-Edm at a MOI of 1 or were left uninfected. 48 h and 72 h post infection cells were assessed by light microscopy. Bars equal 200 μm. (D) Reduced clonogenicity of Jurkat and REH cells. REH and Jurkat cells infected with MV-Edm at a MOI of 1 were seeded in 6-well plates (1 × 10³ cells per well) in methyl-cellulose-containing medium. 14 d later viable colonies were stained by MTT (left panels) and counted (right panel). Similar results were obtained in 2 independent experiments. (E) MV-Edm replicates in Jurkat cells. Jurkat cells (2.5 × 10⁶ cells per 25 cm2 flask) were infected with MV-Edm at a MOI of 1. Cell supernatants were collected at the time points indicated and added to Vero cells. Syncytia formation was determined (upper panel). To quantitate replication infected Jurkat cells were lysed and the TCID50 was determined using Vero cells (lower panel). ***P<0.001 using the unpaired t-test.
