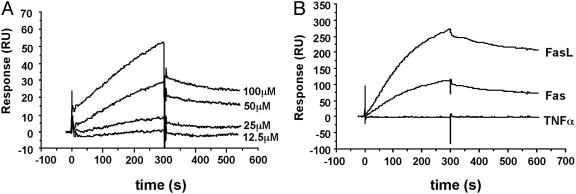
Fig. 2.
Biosensor analysis of mimetic binding to immobilized FasL. The sensorgram shows the relative response in resonance units after background subtraction vs. time in seconds. The association phase injection time was 300 s followed by dissociation in buffer. (A) Sensorgrams showing the binding of Kp7-6 to FasL at Kp7-6 concentrations indicated in the graph. (B) Sensorgrams showing the interaction of Kp7-6 with Fas, FasL, and TNF-α.

