Figure 1.

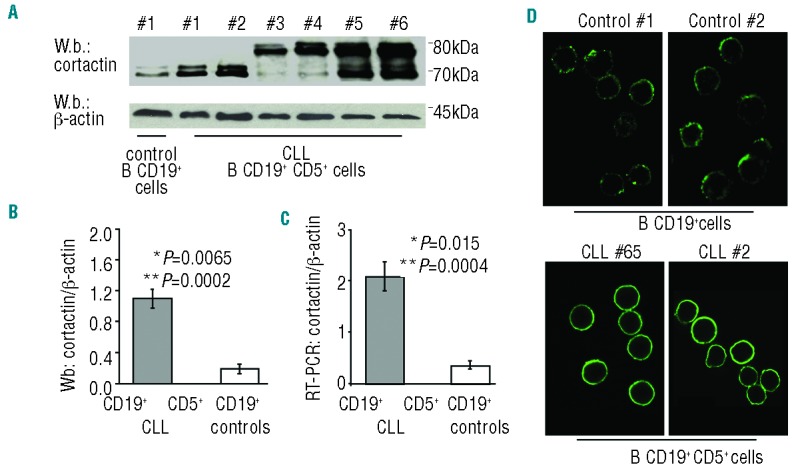
Evaluation of cortactin expression level in patients and healthy subjects. (A) Expression of protein cortactin was evaluated by Western blotting analysis in B CD19+CD5+ lymphocytes of 106 CLL patients and 15 normal CD19+ controls. Figure reports one representative healthy subject (control B CD19+ cells #1) and six representative B CLL patients (CLL B CD19+CD5+ cells #1, #2, #3, #4, #5, #6). (B) Densitometry analysis (arbitrary unit) of cortactin level in CLL patients versus controls. All isoforms of cortactin, presented in Western blotting results of Figure 1A, were measured densitometrically. (C) Evaluation of cortactin expression was assessed at mRNA levels by real-time RT-PCR. (D) Representative confocal microscopy analysis in normal B CD19+ (n=5) and B CD19+CD5+ (n=15) cells of cortactin protein (Alexa-488, green). Original magnification, 60X. Fluorescence was detected using the UltraView LCI confocal system (Perkin Elmer) equipped with a fluorescence filter set for excitation at 488 nm.
