
Figure 5.
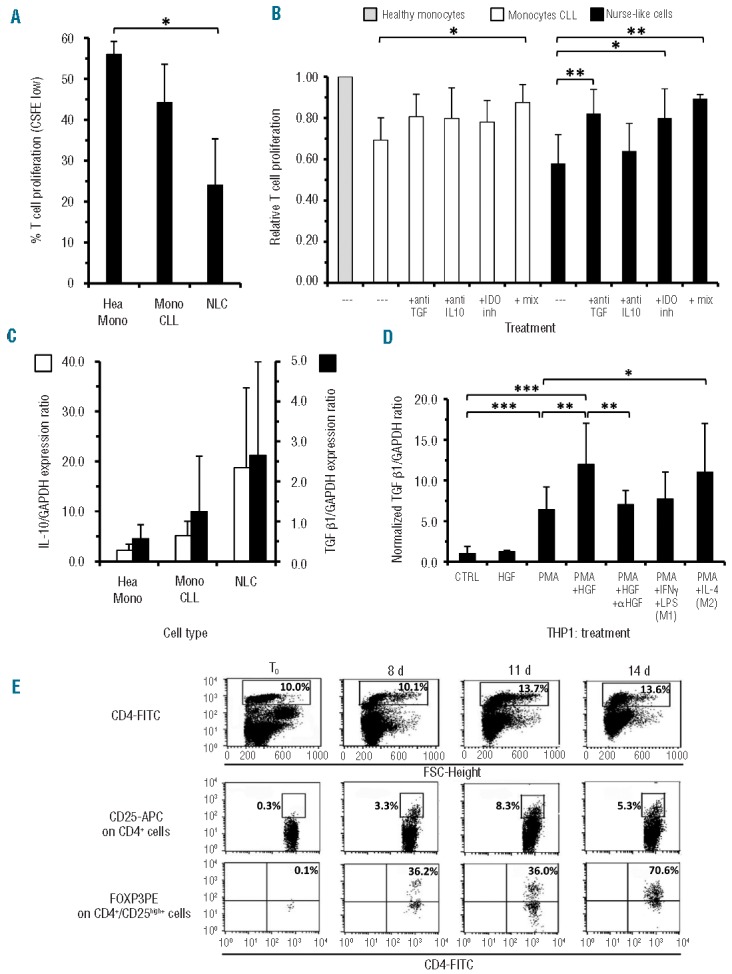
Suppression of T-cell proliferation by monocytes from CLL and NLC, determination of the factors involved and of T regulatory cell expansion in autologous monocyte/peripheral blood mononuclear cell co-cultures. (A) Proliferation of activated T cells, as determined by CFSE staining, was inhibited by addition of either monocytes or NLC (P=0.016, Mann-Whitney) derived from CLL patients but not monocytes from healthy donors. Results are the mean of two independent experiments each with four cases/cell type (n=4). (B) T-cell proliferation in the presence of CLL monocytes (white bars) or NLC (black bars) was restored by the addition of anti-TGFβ, or anti-IL-10 neutralizing antibodies, or IDO inhibitors (inh), as detected by CFSE staining. The combination of these three blocking agents (mix) induced a stronger effect for CLL-monocytes (**) while for NLC even the use of the anti-TGFβ alone (**) was sufficient to restore T-cell proliferation to almost normal values (n=6 for CLL-monocytes; n= 5 for NLC). Data were normalized to proliferation values obtained with T cells and monocytes from healthy subjects (gray bar), P values were calculated by a two sided Mann-Whitney test. (C) According to functional data shown in panel B, higher trends of IL-10 (left y axis, white bars) and TGFβ (right y axis, black bars) mRNA levels were observed in NLC and CLL-monocytes with respect to healthy monocytes as detected by real-time reverse transcriptase-PCR. (D) HGF increased, weakly but significantly, TGFβ mRNA expression in THP-1 cells at basal conditions and in a more marked manner in PMA pre-treated cells: this latter effect was significantly inhibited by the neutralizing anti-HGF humanized monoclonal antibody L2G7. Increased expression of TGFβ mRNA was further induced in THP-1 only on cells polarized towards the M2 phenotype but not towards M1. Data are relative fold increase compared to untreated THP-1 cells of the TGFβ/GAPDH mRNA expression ratio, P values for the Mann-Whitney test. (E) Co-cultures of enriched CLL monocytes with autologous peripheral blood mononuclear cells favor T regulatory cell expansion as determined by three-color staining (CD4/CD25/FOXP3). The lymphocyte subpopulation was gated on forward side scatter (FSC) versus CD4+ cells. Only the CD4+/CD25high+population was further assessed for FOXP3 expression. CD4+/CD25high+/FOXP3+ T regulatory cells progressively expanded in autologous co-culture by day 8 to 14. The maximal FOXP3 expression was reached at day 14 (70.6%).