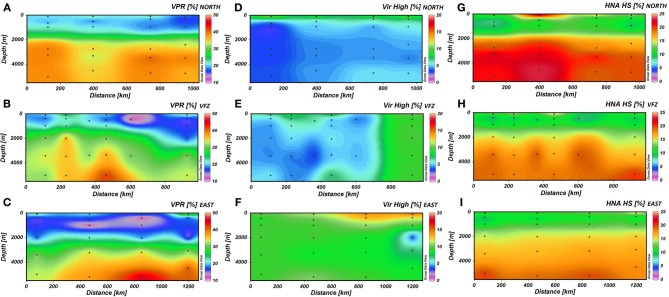
Figure 2.
The spatial distribution of the virus-to-prokaryote ratio (A–C) and the high fluorescence nucleic acid containing viral (D–F), and prokaryotic (G–I) cells north (upper panels), within (center panels) and east (lower panels) of the Vema Fracture Zone of the subtropical North Atlantic Ocean. Each dot represents an individual sampling point. HNA HS, percentage of high nucleic acid containing prokaryotes counted with high-scatter; Vir High, percentage of high fluorescent viruses; VFZ, Vema Fracture Zone; VPR, Virus-to-Prokaryote Ratio.

